Immigrants from Uganda vs Guamanian/Chamorro In Labor Force | Age 20-64
COMPARE
Immigrants from Uganda
Guamanian/Chamorro
In Labor Force | Age 20-64
In Labor Force | Age 20-64 Comparison
Immigrants from Uganda
Guamanians/Chamorros
80.7%
IN LABOR FORCE | AGE 20-64
99.9/ 100
METRIC RATING
28th/ 347
METRIC RANK
79.1%
IN LABOR FORCE | AGE 20-64
4.5/ 100
METRIC RATING
232nd/ 347
METRIC RANK
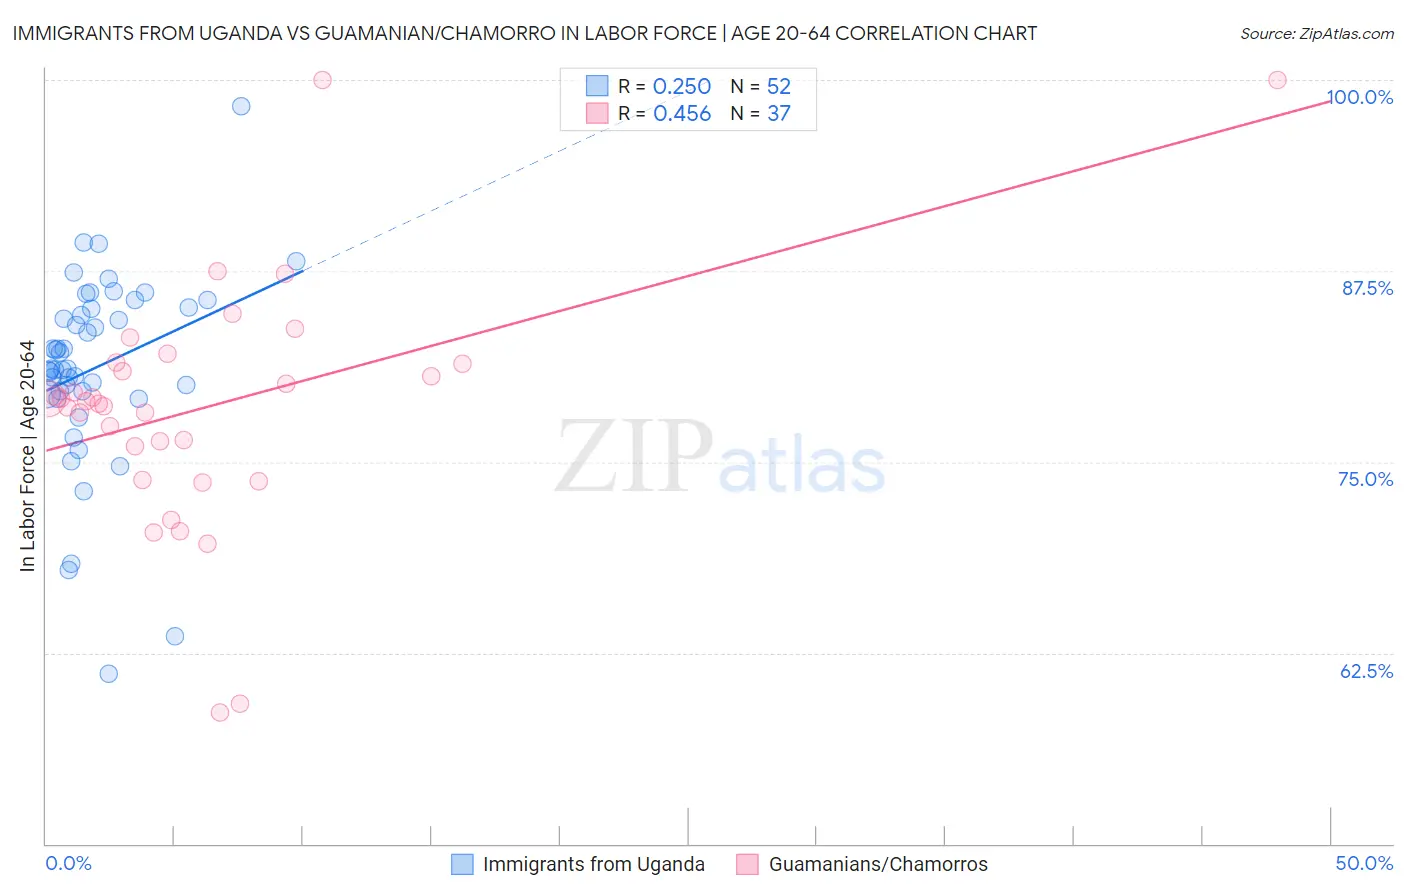
Immigrants from Uganda vs Guamanian/Chamorro In Labor Force | Age 20-64 Correlation Chart
The statistical analysis conducted on geographies consisting of 125,981,186 people shows a weak positive correlation between the proportion of Immigrants from Uganda and labor force participation rate among population between the ages 20 and 64 in the United States with a correlation coefficient (R) of 0.250 and weighted average of 80.7%. Similarly, the statistical analysis conducted on geographies consisting of 221,956,228 people shows a moderate positive correlation between the proportion of Guamanians/Chamorros and labor force participation rate among population between the ages 20 and 64 in the United States with a correlation coefficient (R) of 0.456 and weighted average of 79.1%, a difference of 2.1%.
In Labor Force | Age 20-64 Correlation Summary
| Measurement | Immigrants from Uganda | Guamanian/Chamorro |
| Minimum | 61.1% | 58.6% |
| Maximum | 98.3% | 100.0% |
| Range | 37.2% | 41.4% |
| Mean | 81.2% | 78.6% |
| Median | 81.1% | 79.0% |
| Interquartile 25% (IQ1) | 79.5% | 74.9% |
| Interquartile 75% (IQ3) | 85.0% | 81.4% |
| Interquartile Range (IQR) | 5.5% | 6.5% |
| Standard Deviation (Sample) | 6.3% | 8.1% |
| Standard Deviation (Population) | 6.3% | 7.9% |
Similar Demographics by In Labor Force | Age 20-64
Demographics Similar to Immigrants from Uganda by In Labor Force | Age 20-64
In terms of in labor force | age 20-64, the demographic groups most similar to Immigrants from Uganda are Immigrants from Kenya (80.7%, a difference of 0.010%), Immigrants from South Central Asia (80.7%, a difference of 0.020%), Immigrants from North Macedonia (80.7%, a difference of 0.020%), Immigrants from Lithuania (80.7%, a difference of 0.040%), and Immigrants from Ireland (80.7%, a difference of 0.050%).
| Demographics | Rating | Rank | In Labor Force | Age 20-64 |
| Liberians | 100.0 /100 | #21 | Exceptional 80.9% |
| Sudanese | 100.0 /100 | #22 | Exceptional 80.8% |
| Immigrants | Bosnia and Herzegovina | 100.0 /100 | #23 | Exceptional 80.8% |
| Immigrants | Morocco | 100.0 /100 | #24 | Exceptional 80.8% |
| Kenyans | 100.0 /100 | #25 | Exceptional 80.8% |
| Immigrants | Serbia | 100.0 /100 | #26 | Exceptional 80.8% |
| Immigrants | Kenya | 99.9 /100 | #27 | Exceptional 80.7% |
| Immigrants | Uganda | 99.9 /100 | #28 | Exceptional 80.7% |
| Immigrants | South Central Asia | 99.9 /100 | #29 | Exceptional 80.7% |
| Immigrants | North Macedonia | 99.9 /100 | #30 | Exceptional 80.7% |
| Immigrants | Lithuania | 99.9 /100 | #31 | Exceptional 80.7% |
| Immigrants | Ireland | 99.9 /100 | #32 | Exceptional 80.7% |
| Chinese | 99.9 /100 | #33 | Exceptional 80.7% |
| Immigrants | Brazil | 99.9 /100 | #34 | Exceptional 80.7% |
| Immigrants | Poland | 99.9 /100 | #35 | Exceptional 80.6% |
Demographics Similar to Guamanians/Chamorros by In Labor Force | Age 20-64
In terms of in labor force | age 20-64, the demographic groups most similar to Guamanians/Chamorros are Lebanese (79.1%, a difference of 0.020%), Japanese (79.1%, a difference of 0.030%), Panamanian (79.1%, a difference of 0.050%), Alsatian (79.1%, a difference of 0.050%), and Native Hawaiian (79.1%, a difference of 0.050%).
| Demographics | Rating | Rank | In Labor Force | Age 20-64 |
| Portuguese | 6.4 /100 | #225 | Tragic 79.1% |
| Central Americans | 5.9 /100 | #226 | Tragic 79.1% |
| Immigrants | Western Europe | 5.9 /100 | #227 | Tragic 79.1% |
| Panamanians | 5.7 /100 | #228 | Tragic 79.1% |
| Alsatians | 5.7 /100 | #229 | Tragic 79.1% |
| Native Hawaiians | 5.6 /100 | #230 | Tragic 79.1% |
| Lebanese | 5.1 /100 | #231 | Tragic 79.1% |
| Guamanians/Chamorros | 4.5 /100 | #232 | Tragic 79.1% |
| Japanese | 4.0 /100 | #233 | Tragic 79.1% |
| Immigrants | Canada | 3.2 /100 | #234 | Tragic 79.0% |
| Tlingit-Haida | 3.2 /100 | #235 | Tragic 79.0% |
| Samoans | 2.9 /100 | #236 | Tragic 79.0% |
| Immigrants | North America | 2.9 /100 | #237 | Tragic 79.0% |
| Immigrants | Jamaica | 2.6 /100 | #238 | Tragic 79.0% |
| Welsh | 2.4 /100 | #239 | Tragic 79.0% |