Sri Lankan vs Czech In Labor Force | Age 20-64
COMPARE
Sri Lankan
Czech
In Labor Force | Age 20-64
In Labor Force | Age 20-64 Comparison
Sri Lankans
Czechs
80.0%
IN LABOR FORCE | AGE 20-64
93.9/ 100
METRIC RATING
113th/ 347
METRIC RANK
80.5%
IN LABOR FORCE | AGE 20-64
99.7/ 100
METRIC RATING
43rd/ 347
METRIC RANK
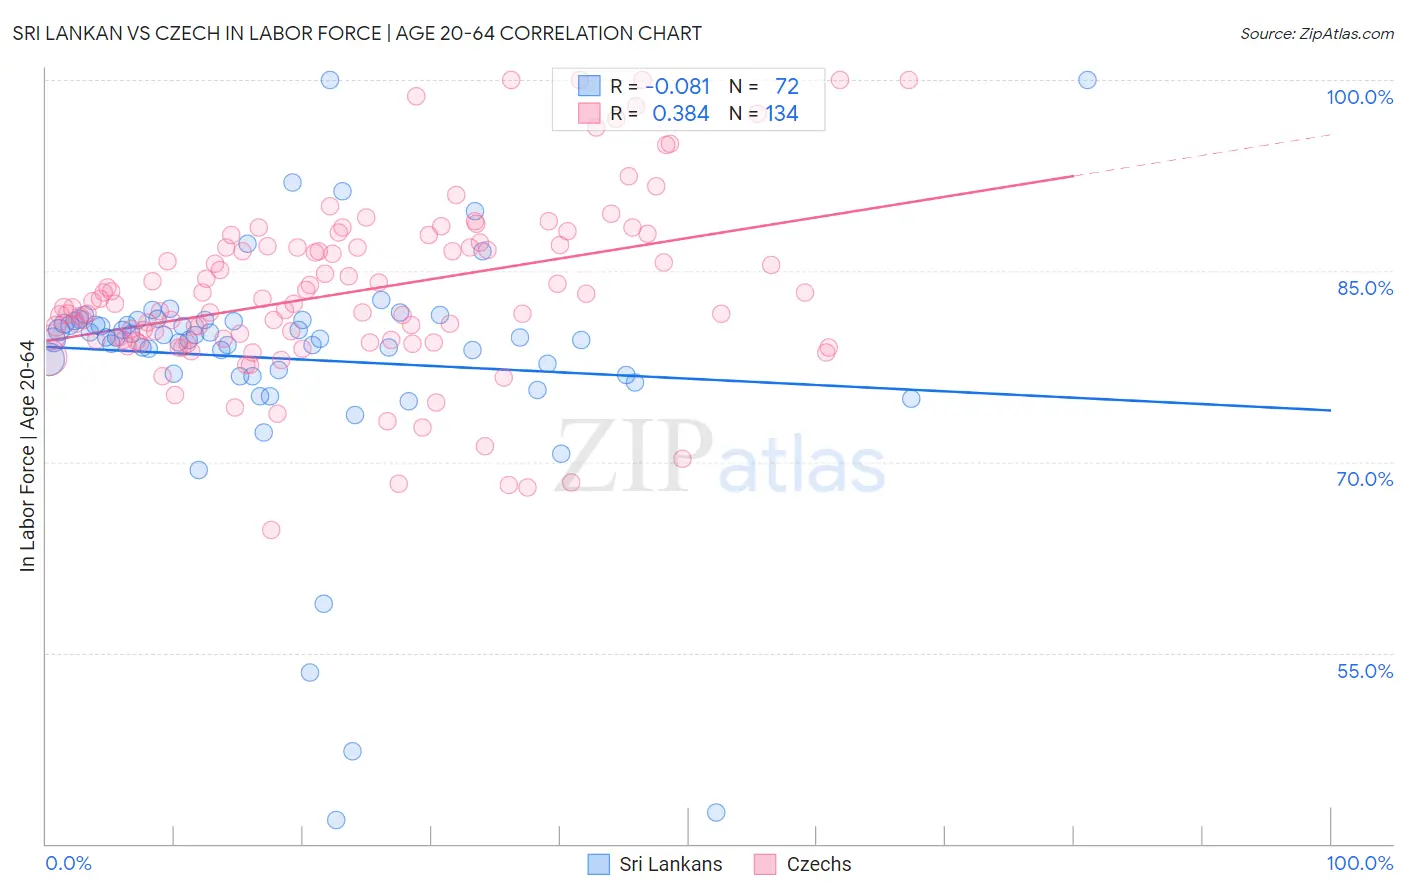
Sri Lankan vs Czech In Labor Force | Age 20-64 Correlation Chart
The statistical analysis conducted on geographies consisting of 440,614,161 people shows a slight negative correlation between the proportion of Sri Lankans and labor force participation rate among population between the ages 20 and 64 in the United States with a correlation coefficient (R) of -0.081 and weighted average of 80.0%. Similarly, the statistical analysis conducted on geographies consisting of 484,822,871 people shows a mild positive correlation between the proportion of Czechs and labor force participation rate among population between the ages 20 and 64 in the United States with a correlation coefficient (R) of 0.384 and weighted average of 80.5%, a difference of 0.65%.
In Labor Force | Age 20-64 Correlation Summary
| Measurement | Sri Lankan | Czech |
| Minimum | 41.9% | 64.6% |
| Maximum | 100.0% | 100.0% |
| Range | 58.1% | 35.4% |
| Mean | 78.1% | 83.3% |
| Median | 79.8% | 82.3% |
| Interquartile 25% (IQ1) | 76.9% | 79.6% |
| Interquartile 75% (IQ3) | 81.1% | 86.8% |
| Interquartile Range (IQR) | 4.2% | 7.3% |
| Standard Deviation (Sample) | 9.6% | 6.9% |
| Standard Deviation (Population) | 9.6% | 6.8% |
Similar Demographics by In Labor Force | Age 20-64
Demographics Similar to Sri Lankans by In Labor Force | Age 20-64
In terms of in labor force | age 20-64, the demographic groups most similar to Sri Lankans are Estonian (80.0%, a difference of 0.0%), Immigrants from South America (80.0%, a difference of 0.0%), Immigrants from Italy (80.0%, a difference of 0.0%), Argentinean (80.0%, a difference of 0.0%), and Immigrants from Argentina (80.0%, a difference of 0.010%).
| Demographics | Rating | Rank | In Labor Force | Age 20-64 |
| Greeks | 94.8 /100 | #106 | Exceptional 80.0% |
| Immigrants | Jordan | 94.8 /100 | #107 | Exceptional 80.0% |
| Iranians | 94.3 /100 | #108 | Exceptional 80.0% |
| Immigrants | Argentina | 94.1 /100 | #109 | Exceptional 80.0% |
| Estonians | 94.0 /100 | #110 | Exceptional 80.0% |
| Immigrants | South America | 93.9 /100 | #111 | Exceptional 80.0% |
| Immigrants | Italy | 93.9 /100 | #112 | Exceptional 80.0% |
| Sri Lankans | 93.9 /100 | #113 | Exceptional 80.0% |
| Argentineans | 93.8 /100 | #114 | Exceptional 80.0% |
| Bermudans | 93.3 /100 | #115 | Exceptional 80.0% |
| Immigrants | Western Africa | 93.1 /100 | #116 | Exceptional 80.0% |
| Immigrants | Vietnam | 92.7 /100 | #117 | Exceptional 80.0% |
| Cape Verdeans | 92.7 /100 | #118 | Exceptional 80.0% |
| Immigrants | Taiwan | 92.5 /100 | #119 | Exceptional 80.0% |
| Maltese | 92.4 /100 | #120 | Exceptional 80.0% |
Demographics Similar to Czechs by In Labor Force | Age 20-64
In terms of in labor force | age 20-64, the demographic groups most similar to Czechs are Latvian (80.5%, a difference of 0.010%), Immigrants from Liberia (80.5%, a difference of 0.030%), Immigrants from Middle Africa (80.5%, a difference of 0.030%), Brazilian (80.5%, a difference of 0.040%), and Immigrants from Zimbabwe (80.5%, a difference of 0.040%).
| Demographics | Rating | Rank | In Labor Force | Age 20-64 |
| Paraguayans | 99.8 /100 | #36 | Exceptional 80.6% |
| Immigrants | Moldova | 99.8 /100 | #37 | Exceptional 80.6% |
| Ugandans | 99.8 /100 | #38 | Exceptional 80.6% |
| Brazilians | 99.8 /100 | #39 | Exceptional 80.5% |
| Immigrants | Zimbabwe | 99.8 /100 | #40 | Exceptional 80.5% |
| Immigrants | Liberia | 99.8 /100 | #41 | Exceptional 80.5% |
| Latvians | 99.8 /100 | #42 | Exceptional 80.5% |
| Czechs | 99.7 /100 | #43 | Exceptional 80.5% |
| Immigrants | Middle Africa | 99.7 /100 | #44 | Exceptional 80.5% |
| Slovenes | 99.7 /100 | #45 | Exceptional 80.5% |
| Immigrants | Pakistan | 99.6 /100 | #46 | Exceptional 80.5% |
| Immigrants | Africa | 99.6 /100 | #47 | Exceptional 80.4% |
| Immigrants | Hong Kong | 99.5 /100 | #48 | Exceptional 80.4% |
| Immigrants | Greece | 99.4 /100 | #49 | Exceptional 80.4% |
| Immigrants | Sudan | 99.4 /100 | #50 | Exceptional 80.4% |