Cheyenne vs Immigrants from Chile In Labor Force | Age 20-24
COMPARE
Cheyenne
Immigrants from Chile
In Labor Force | Age 20-24
In Labor Force | Age 20-24 Comparison
Cheyenne
Immigrants from Chile
73.4%
IN LABOR FORCE | AGE 20-24
0.2/ 100
METRIC RATING
273rd/ 347
METRIC RANK
74.1%
IN LABOR FORCE | AGE 20-24
3.7/ 100
METRIC RATING
233rd/ 347
METRIC RANK
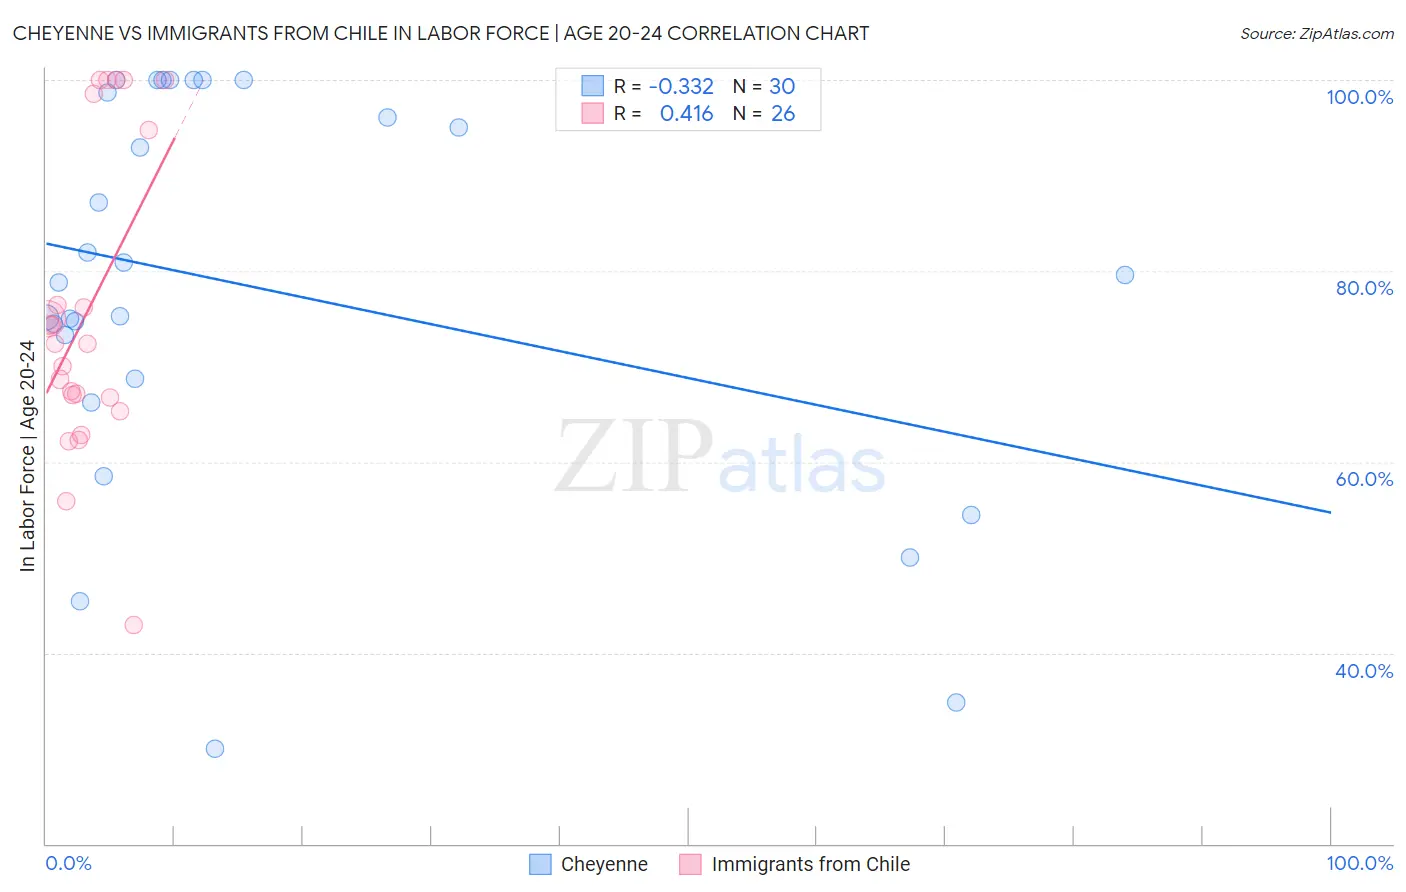
Cheyenne vs Immigrants from Chile In Labor Force | Age 20-24 Correlation Chart
The statistical analysis conducted on geographies consisting of 80,658,593 people shows a mild negative correlation between the proportion of Cheyenne and labor force participation rate among population between the ages 20 and 24 in the United States with a correlation coefficient (R) of -0.332 and weighted average of 73.4%. Similarly, the statistical analysis conducted on geographies consisting of 218,628,779 people shows a moderate positive correlation between the proportion of Immigrants from Chile and labor force participation rate among population between the ages 20 and 24 in the United States with a correlation coefficient (R) of 0.416 and weighted average of 74.1%, a difference of 1.0%.
In Labor Force | Age 20-24 Correlation Summary
| Measurement | Cheyenne | Immigrants from Chile |
| Minimum | 30.0% | 42.9% |
| Maximum | 100.0% | 100.0% |
| Range | 70.0% | 57.1% |
| Mean | 78.2% | 75.9% |
| Median | 79.2% | 72.4% |
| Interquartile 25% (IQ1) | 68.6% | 66.8% |
| Interquartile 75% (IQ3) | 98.7% | 94.7% |
| Interquartile Range (IQR) | 30.1% | 27.9% |
| Standard Deviation (Sample) | 20.4% | 15.9% |
| Standard Deviation (Population) | 20.0% | 15.6% |
Similar Demographics by In Labor Force | Age 20-24
Demographics Similar to Cheyenne by In Labor Force | Age 20-24
In terms of in labor force | age 20-24, the demographic groups most similar to Cheyenne are Immigrants from Colombia (73.4%, a difference of 0.020%), Belizean (73.4%, a difference of 0.030%), Immigrants from Indonesia (73.4%, a difference of 0.040%), Immigrants from South America (73.3%, a difference of 0.070%), and Mongolian (73.3%, a difference of 0.080%).
| Demographics | Rating | Rank | In Labor Force | Age 20-24 |
| Haitians | 0.5 /100 | #266 | Tragic 73.6% |
| Immigrants | Western Asia | 0.4 /100 | #267 | Tragic 73.5% |
| South Americans | 0.4 /100 | #268 | Tragic 73.5% |
| Colombians | 0.3 /100 | #269 | Tragic 73.5% |
| Immigrants | Russia | 0.3 /100 | #270 | Tragic 73.5% |
| Immigrants | Indonesia | 0.3 /100 | #271 | Tragic 73.4% |
| Belizeans | 0.3 /100 | #272 | Tragic 73.4% |
| Cheyenne | 0.2 /100 | #273 | Tragic 73.4% |
| Immigrants | Colombia | 0.2 /100 | #274 | Tragic 73.4% |
| Immigrants | South America | 0.2 /100 | #275 | Tragic 73.3% |
| Mongolians | 0.2 /100 | #276 | Tragic 73.3% |
| Immigrants | Malaysia | 0.2 /100 | #277 | Tragic 73.3% |
| Cypriots | 0.2 /100 | #278 | Tragic 73.3% |
| Venezuelans | 0.2 /100 | #279 | Tragic 73.3% |
| Bahamians | 0.1 /100 | #280 | Tragic 73.3% |
Demographics Similar to Immigrants from Chile by In Labor Force | Age 20-24
In terms of in labor force | age 20-24, the demographic groups most similar to Immigrants from Chile are Immigrants (74.1%, a difference of 0.010%), Laotian (74.1%, a difference of 0.020%), Immigrants from Switzerland (74.2%, a difference of 0.040%), Immigrants from France (74.1%, a difference of 0.040%), and Immigrants from Greece (74.2%, a difference of 0.050%).
| Demographics | Rating | Rank | In Labor Force | Age 20-24 |
| Immigrants | Fiji | 5.9 /100 | #226 | Tragic 74.3% |
| Immigrants | Ireland | 5.8 /100 | #227 | Tragic 74.3% |
| Immigrants | Ukraine | 5.1 /100 | #228 | Tragic 74.2% |
| Immigrants | Sweden | 4.6 /100 | #229 | Tragic 74.2% |
| Immigrants | Albania | 4.3 /100 | #230 | Tragic 74.2% |
| Immigrants | Greece | 4.1 /100 | #231 | Tragic 74.2% |
| Immigrants | Switzerland | 4.1 /100 | #232 | Tragic 74.2% |
| Immigrants | Chile | 3.7 /100 | #233 | Tragic 74.1% |
| Immigrants | Immigrants | 3.6 /100 | #234 | Tragic 74.1% |
| Laotians | 3.5 /100 | #235 | Tragic 74.1% |
| Immigrants | France | 3.3 /100 | #236 | Tragic 74.1% |
| Bermudans | 3.2 /100 | #237 | Tragic 74.1% |
| Immigrants | Japan | 3.0 /100 | #238 | Tragic 74.1% |
| Immigrants | Latin America | 2.7 /100 | #239 | Tragic 74.1% |
| Immigrants | Sri Lanka | 2.3 /100 | #240 | Tragic 74.0% |