Cheyenne vs Immigrants from Honduras In Labor Force | Age 20-24
COMPARE
Cheyenne
Immigrants from Honduras
In Labor Force | Age 20-24
In Labor Force | Age 20-24 Comparison
Cheyenne
Immigrants from Honduras
73.4%
IN LABOR FORCE | AGE 20-24
0.2/ 100
METRIC RATING
273rd/ 347
METRIC RANK
74.9%
IN LABOR FORCE | AGE 20-24
33.5/ 100
METRIC RATING
187th/ 347
METRIC RANK
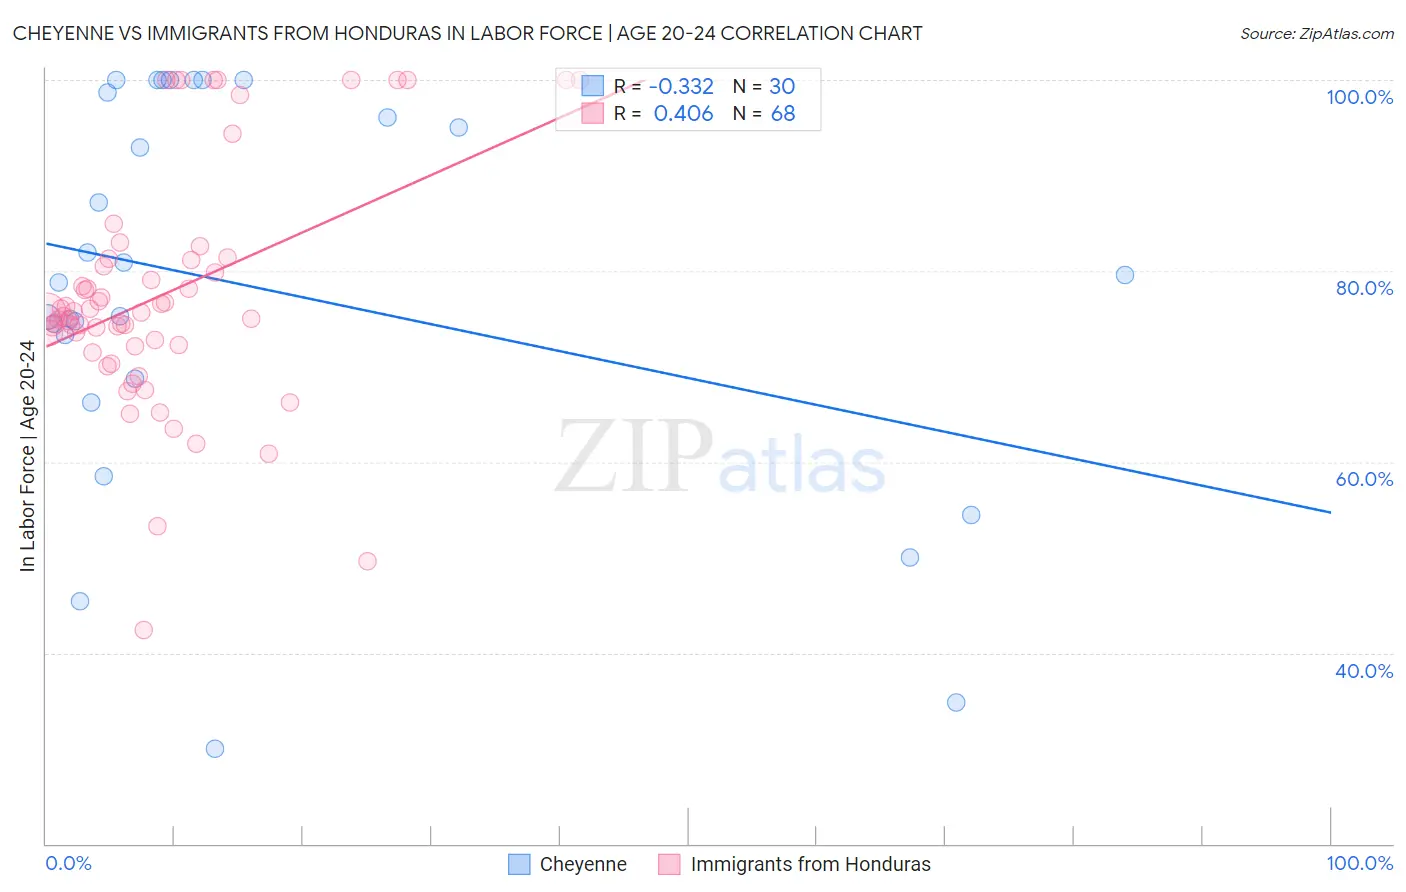
Cheyenne vs Immigrants from Honduras In Labor Force | Age 20-24 Correlation Chart
The statistical analysis conducted on geographies consisting of 80,658,593 people shows a mild negative correlation between the proportion of Cheyenne and labor force participation rate among population between the ages 20 and 24 in the United States with a correlation coefficient (R) of -0.332 and weighted average of 73.4%. Similarly, the statistical analysis conducted on geographies consisting of 322,549,520 people shows a moderate positive correlation between the proportion of Immigrants from Honduras and labor force participation rate among population between the ages 20 and 24 in the United States with a correlation coefficient (R) of 0.406 and weighted average of 74.9%, a difference of 2.0%.
In Labor Force | Age 20-24 Correlation Summary
| Measurement | Cheyenne | Immigrants from Honduras |
| Minimum | 30.0% | 42.4% |
| Maximum | 100.0% | 100.0% |
| Range | 70.0% | 57.6% |
| Mean | 78.2% | 77.5% |
| Median | 79.2% | 75.7% |
| Interquartile 25% (IQ1) | 68.6% | 72.2% |
| Interquartile 75% (IQ3) | 98.7% | 81.3% |
| Interquartile Range (IQR) | 30.1% | 9.1% |
| Standard Deviation (Sample) | 20.4% | 12.5% |
| Standard Deviation (Population) | 20.0% | 12.4% |
Similar Demographics by In Labor Force | Age 20-24
Demographics Similar to Cheyenne by In Labor Force | Age 20-24
In terms of in labor force | age 20-24, the demographic groups most similar to Cheyenne are Immigrants from Colombia (73.4%, a difference of 0.020%), Belizean (73.4%, a difference of 0.030%), Immigrants from Indonesia (73.4%, a difference of 0.040%), Immigrants from South America (73.3%, a difference of 0.070%), and Mongolian (73.3%, a difference of 0.080%).
| Demographics | Rating | Rank | In Labor Force | Age 20-24 |
| Haitians | 0.5 /100 | #266 | Tragic 73.6% |
| Immigrants | Western Asia | 0.4 /100 | #267 | Tragic 73.5% |
| South Americans | 0.4 /100 | #268 | Tragic 73.5% |
| Colombians | 0.3 /100 | #269 | Tragic 73.5% |
| Immigrants | Russia | 0.3 /100 | #270 | Tragic 73.5% |
| Immigrants | Indonesia | 0.3 /100 | #271 | Tragic 73.4% |
| Belizeans | 0.3 /100 | #272 | Tragic 73.4% |
| Cheyenne | 0.2 /100 | #273 | Tragic 73.4% |
| Immigrants | Colombia | 0.2 /100 | #274 | Tragic 73.4% |
| Immigrants | South America | 0.2 /100 | #275 | Tragic 73.3% |
| Mongolians | 0.2 /100 | #276 | Tragic 73.3% |
| Immigrants | Malaysia | 0.2 /100 | #277 | Tragic 73.3% |
| Cypriots | 0.2 /100 | #278 | Tragic 73.3% |
| Venezuelans | 0.2 /100 | #279 | Tragic 73.3% |
| Bahamians | 0.1 /100 | #280 | Tragic 73.3% |
Demographics Similar to Immigrants from Honduras by In Labor Force | Age 20-24
In terms of in labor force | age 20-24, the demographic groups most similar to Immigrants from Honduras are Immigrants from Eastern Europe (74.9%, a difference of 0.010%), Honduran (74.8%, a difference of 0.010%), Immigrants from Northern Europe (74.8%, a difference of 0.010%), Immigrants from Hungary (74.9%, a difference of 0.020%), and Sri Lankan (74.9%, a difference of 0.020%).
| Demographics | Rating | Rank | In Labor Force | Age 20-24 |
| Immigrants | Czechoslovakia | 44.0 /100 | #180 | Average 75.0% |
| Africans | 42.5 /100 | #181 | Average 75.0% |
| Immigrants | South Africa | 36.9 /100 | #182 | Fair 74.9% |
| Immigrants | Costa Rica | 36.7 /100 | #183 | Fair 74.9% |
| Immigrants | Hungary | 35.0 /100 | #184 | Fair 74.9% |
| Sri Lankans | 34.9 /100 | #185 | Fair 74.9% |
| Immigrants | Eastern Europe | 33.8 /100 | #186 | Fair 74.9% |
| Immigrants | Honduras | 33.5 /100 | #187 | Fair 74.9% |
| Hondurans | 32.7 /100 | #188 | Fair 74.8% |
| Immigrants | Northern Europe | 32.6 /100 | #189 | Fair 74.8% |
| Russians | 32.2 /100 | #190 | Fair 74.8% |
| Senegalese | 28.1 /100 | #191 | Fair 74.8% |
| Immigrants | Europe | 27.5 /100 | #192 | Fair 74.8% |
| Alsatians | 27.1 /100 | #193 | Fair 74.8% |
| Immigrants | Denmark | 25.8 /100 | #194 | Fair 74.8% |