Cheyenne vs Immigrants from India In Labor Force | Age 20-24
COMPARE
Cheyenne
Immigrants from India
In Labor Force | Age 20-24
In Labor Force | Age 20-24 Comparison
Cheyenne
Immigrants from India
73.4%
IN LABOR FORCE | AGE 20-24
0.2/ 100
METRIC RATING
273rd/ 347
METRIC RANK
74.4%
IN LABOR FORCE | AGE 20-24
9.9/ 100
METRIC RATING
222nd/ 347
METRIC RANK
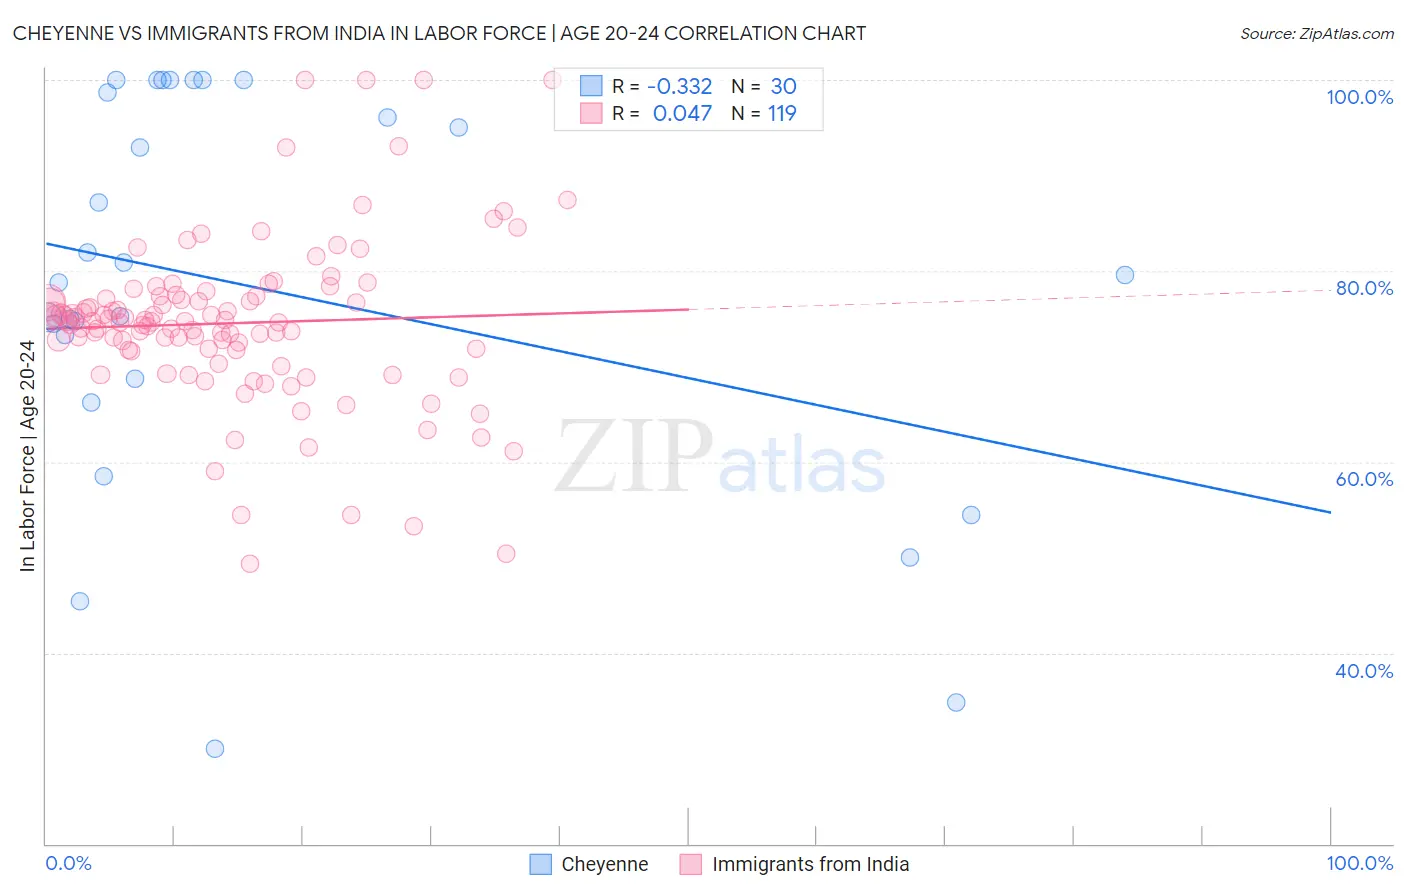
Cheyenne vs Immigrants from India In Labor Force | Age 20-24 Correlation Chart
The statistical analysis conducted on geographies consisting of 80,658,593 people shows a mild negative correlation between the proportion of Cheyenne and labor force participation rate among population between the ages 20 and 24 in the United States with a correlation coefficient (R) of -0.332 and weighted average of 73.4%. Similarly, the statistical analysis conducted on geographies consisting of 433,974,099 people shows no correlation between the proportion of Immigrants from India and labor force participation rate among population between the ages 20 and 24 in the United States with a correlation coefficient (R) of 0.047 and weighted average of 74.4%, a difference of 1.4%.
In Labor Force | Age 20-24 Correlation Summary
| Measurement | Cheyenne | Immigrants from India |
| Minimum | 30.0% | 49.4% |
| Maximum | 100.0% | 100.0% |
| Range | 70.0% | 50.6% |
| Mean | 78.2% | 74.5% |
| Median | 79.2% | 74.7% |
| Interquartile 25% (IQ1) | 68.6% | 71.7% |
| Interquartile 75% (IQ3) | 98.7% | 77.3% |
| Interquartile Range (IQR) | 30.1% | 5.6% |
| Standard Deviation (Sample) | 20.4% | 8.7% |
| Standard Deviation (Population) | 20.0% | 8.7% |
Similar Demographics by In Labor Force | Age 20-24
Demographics Similar to Cheyenne by In Labor Force | Age 20-24
In terms of in labor force | age 20-24, the demographic groups most similar to Cheyenne are Immigrants from Colombia (73.4%, a difference of 0.020%), Belizean (73.4%, a difference of 0.030%), Immigrants from Indonesia (73.4%, a difference of 0.040%), Immigrants from South America (73.3%, a difference of 0.070%), and Mongolian (73.3%, a difference of 0.080%).
| Demographics | Rating | Rank | In Labor Force | Age 20-24 |
| Haitians | 0.5 /100 | #266 | Tragic 73.6% |
| Immigrants | Western Asia | 0.4 /100 | #267 | Tragic 73.5% |
| South Americans | 0.4 /100 | #268 | Tragic 73.5% |
| Colombians | 0.3 /100 | #269 | Tragic 73.5% |
| Immigrants | Russia | 0.3 /100 | #270 | Tragic 73.5% |
| Immigrants | Indonesia | 0.3 /100 | #271 | Tragic 73.4% |
| Belizeans | 0.3 /100 | #272 | Tragic 73.4% |
| Cheyenne | 0.2 /100 | #273 | Tragic 73.4% |
| Immigrants | Colombia | 0.2 /100 | #274 | Tragic 73.4% |
| Immigrants | South America | 0.2 /100 | #275 | Tragic 73.3% |
| Mongolians | 0.2 /100 | #276 | Tragic 73.3% |
| Immigrants | Malaysia | 0.2 /100 | #277 | Tragic 73.3% |
| Cypriots | 0.2 /100 | #278 | Tragic 73.3% |
| Venezuelans | 0.2 /100 | #279 | Tragic 73.3% |
| Bahamians | 0.1 /100 | #280 | Tragic 73.3% |
Demographics Similar to Immigrants from India by In Labor Force | Age 20-24
In terms of in labor force | age 20-24, the demographic groups most similar to Immigrants from India are Immigrants from Norway (74.5%, a difference of 0.020%), Chickasaw (74.5%, a difference of 0.020%), Immigrants from Peru (74.5%, a difference of 0.030%), Nepalese (74.5%, a difference of 0.030%), and Hispanic or Latino (74.4%, a difference of 0.090%).
| Demographics | Rating | Rank | In Labor Force | Age 20-24 |
| Immigrants | Ghana | 12.7 /100 | #215 | Poor 74.5% |
| Immigrants | Kuwait | 12.7 /100 | #216 | Poor 74.5% |
| Chileans | 12.5 /100 | #217 | Poor 74.5% |
| Immigrants | Peru | 10.6 /100 | #218 | Poor 74.5% |
| Nepalese | 10.5 /100 | #219 | Poor 74.5% |
| Immigrants | Norway | 10.3 /100 | #220 | Poor 74.5% |
| Chickasaw | 10.3 /100 | #221 | Poor 74.5% |
| Immigrants | India | 9.9 /100 | #222 | Tragic 74.4% |
| Hispanics or Latinos | 7.9 /100 | #223 | Tragic 74.4% |
| Seminole | 6.9 /100 | #224 | Tragic 74.3% |
| Ghanaians | 6.2 /100 | #225 | Tragic 74.3% |
| Immigrants | Fiji | 5.9 /100 | #226 | Tragic 74.3% |
| Immigrants | Ireland | 5.8 /100 | #227 | Tragic 74.3% |
| Immigrants | Ukraine | 5.1 /100 | #228 | Tragic 74.2% |
| Immigrants | Sweden | 4.6 /100 | #229 | Tragic 74.2% |