Cherokee vs Australian In Labor Force | Age > 16
COMPARE
Cherokee
Australian
In Labor Force | Age > 16
In Labor Force | Age > 16 Comparison
Cherokee
Australians
61.9%
IN LABOR FORCE | AGE > 16
0.0/ 100
METRIC RATING
325th/ 347
METRIC RANK
65.3%
IN LABOR FORCE | AGE > 16
71.3/ 100
METRIC RATING
161st/ 347
METRIC RANK
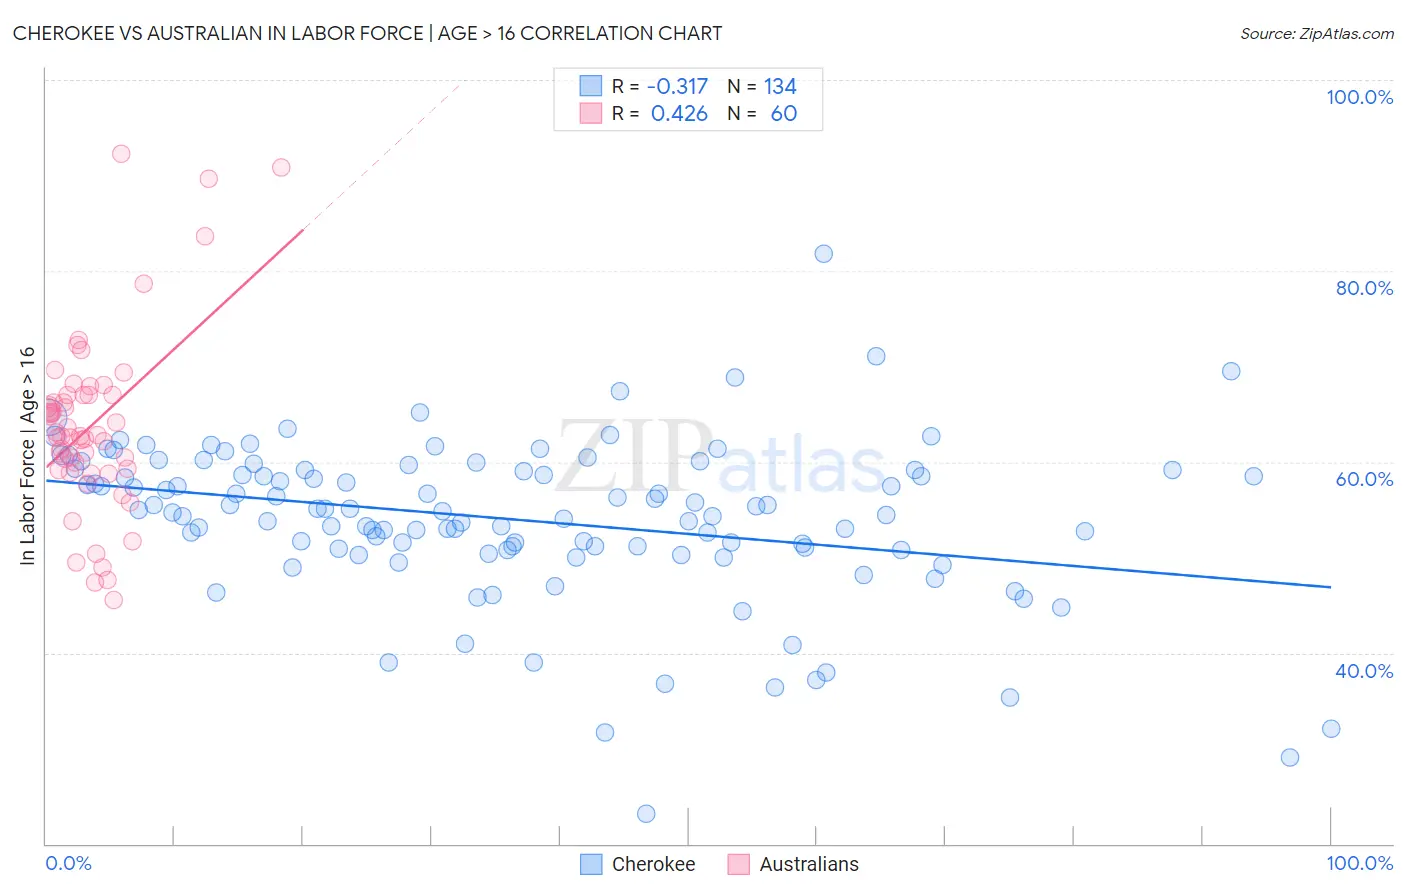
Cherokee vs Australian In Labor Force | Age > 16 Correlation Chart
The statistical analysis conducted on geographies consisting of 493,683,213 people shows a mild negative correlation between the proportion of Cherokee and labor force participation rate among population ages 16 and over in the United States with a correlation coefficient (R) of -0.317 and weighted average of 61.9%. Similarly, the statistical analysis conducted on geographies consisting of 224,163,192 people shows a moderate positive correlation between the proportion of Australians and labor force participation rate among population ages 16 and over in the United States with a correlation coefficient (R) of 0.426 and weighted average of 65.3%, a difference of 5.4%.
In Labor Force | Age > 16 Correlation Summary
| Measurement | Cherokee | Australian |
| Minimum | 23.1% | 45.5% |
| Maximum | 81.8% | 92.3% |
| Range | 58.7% | 46.8% |
| Mean | 54.0% | 63.8% |
| Median | 54.9% | 62.8% |
| Interquartile 25% (IQ1) | 50.9% | 59.2% |
| Interquartile 75% (IQ3) | 59.1% | 67.0% |
| Interquartile Range (IQR) | 8.2% | 7.8% |
| Standard Deviation (Sample) | 8.4% | 9.5% |
| Standard Deviation (Population) | 8.4% | 9.4% |
Similar Demographics by In Labor Force | Age > 16
Demographics Similar to Cherokee by In Labor Force | Age > 16
In terms of in labor force | age > 16, the demographic groups most similar to Cherokee are Cheyenne (62.0%, a difference of 0.050%), Seminole (62.0%, a difference of 0.090%), Ottawa (62.0%, a difference of 0.11%), Sioux (61.8%, a difference of 0.17%), and American (62.1%, a difference of 0.27%).
| Demographics | Rating | Rank | In Labor Force | Age > 16 |
| Chickasaw | 0.0 /100 | #318 | Tragic 62.3% |
| Arapaho | 0.0 /100 | #319 | Tragic 62.1% |
| Yakama | 0.0 /100 | #320 | Tragic 62.1% |
| Americans | 0.0 /100 | #321 | Tragic 62.1% |
| Ottawa | 0.0 /100 | #322 | Tragic 62.0% |
| Seminole | 0.0 /100 | #323 | Tragic 62.0% |
| Cheyenne | 0.0 /100 | #324 | Tragic 62.0% |
| Cherokee | 0.0 /100 | #325 | Tragic 61.9% |
| Sioux | 0.0 /100 | #326 | Tragic 61.8% |
| Cajuns | 0.0 /100 | #327 | Tragic 61.8% |
| Dutch West Indians | 0.0 /100 | #328 | Tragic 61.7% |
| Choctaw | 0.0 /100 | #329 | Tragic 61.5% |
| Creek | 0.0 /100 | #330 | Tragic 61.3% |
| Ute | 0.0 /100 | #331 | Tragic 60.9% |
| Crow | 0.0 /100 | #332 | Tragic 60.8% |
Demographics Similar to Australians by In Labor Force | Age > 16
In terms of in labor force | age > 16, the demographic groups most similar to Australians are Albanian (65.3%, a difference of 0.010%), South African (65.3%, a difference of 0.020%), Immigrants from South Africa (65.3%, a difference of 0.030%), Danish (65.3%, a difference of 0.030%), and Immigrants from Kazakhstan (65.3%, a difference of 0.040%).
| Demographics | Rating | Rank | In Labor Force | Age > 16 |
| Immigrants | Eastern Europe | 78.3 /100 | #154 | Good 65.4% |
| Immigrants | Armenia | 76.6 /100 | #155 | Good 65.3% |
| Immigrants | Ireland | 75.9 /100 | #156 | Good 65.3% |
| Immigrants | Russia | 75.7 /100 | #157 | Good 65.3% |
| Panamanians | 75.2 /100 | #158 | Good 65.3% |
| Immigrants | Syria | 74.6 /100 | #159 | Good 65.3% |
| Immigrants | South Africa | 73.5 /100 | #160 | Good 65.3% |
| Australians | 71.3 /100 | #161 | Good 65.3% |
| Albanians | 70.8 /100 | #162 | Good 65.3% |
| South Africans | 69.8 /100 | #163 | Good 65.3% |
| Danes | 68.8 /100 | #164 | Good 65.3% |
| Immigrants | Kazakhstan | 68.1 /100 | #165 | Good 65.3% |
| Immigrants | Western Asia | 67.3 /100 | #166 | Good 65.3% |
| Immigrants | Belarus | 66.0 /100 | #167 | Good 65.2% |
| Serbians | 63.5 /100 | #168 | Good 65.2% |