Cherokee vs Immigrants from Ecuador In Labor Force | Age 30-34
COMPARE
Cherokee
Immigrants from Ecuador
In Labor Force | Age 30-34
In Labor Force | Age 30-34 Comparison
Cherokee
Immigrants from Ecuador
81.6%
IN LABOR FORCE | AGE 30-34
0.0/ 100
METRIC RATING
315th/ 347
METRIC RANK
84.3%
IN LABOR FORCE | AGE 30-34
7.1/ 100
METRIC RATING
216th/ 347
METRIC RANK
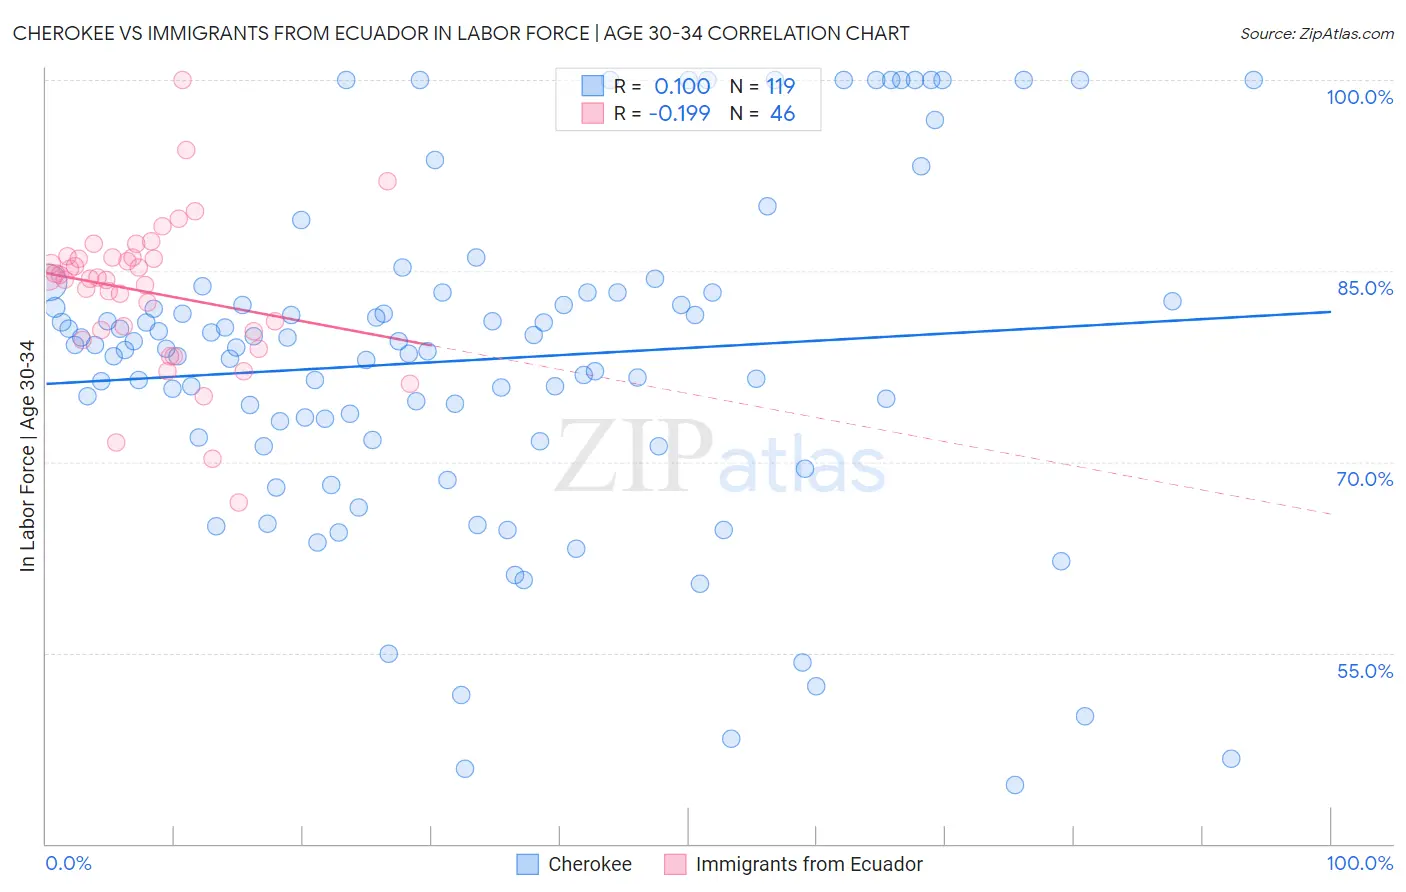
Cherokee vs Immigrants from Ecuador In Labor Force | Age 30-34 Correlation Chart
The statistical analysis conducted on geographies consisting of 493,185,438 people shows a poor positive correlation between the proportion of Cherokee and labor force participation rate among population between the ages 30 and 34 in the United States with a correlation coefficient (R) of 0.100 and weighted average of 81.6%. Similarly, the statistical analysis conducted on geographies consisting of 270,923,520 people shows a poor negative correlation between the proportion of Immigrants from Ecuador and labor force participation rate among population between the ages 30 and 34 in the United States with a correlation coefficient (R) of -0.199 and weighted average of 84.3%, a difference of 3.3%.
In Labor Force | Age 30-34 Correlation Summary
| Measurement | Cherokee | Immigrants from Ecuador |
| Minimum | 44.6% | 66.8% |
| Maximum | 100.0% | 100.0% |
| Range | 55.4% | 33.2% |
| Mean | 78.0% | 83.3% |
| Median | 79.0% | 84.5% |
| Interquartile 25% (IQ1) | 71.7% | 80.3% |
| Interquartile 75% (IQ3) | 83.3% | 86.1% |
| Interquartile Range (IQR) | 11.6% | 5.8% |
| Standard Deviation (Sample) | 13.1% | 5.9% |
| Standard Deviation (Population) | 13.0% | 5.9% |
Similar Demographics by In Labor Force | Age 30-34
Demographics Similar to Cherokee by In Labor Force | Age 30-34
In terms of in labor force | age 30-34, the demographic groups most similar to Cherokee are Alaskan Athabascan (81.7%, a difference of 0.10%), Immigrants from the Azores (81.5%, a difference of 0.15%), Arapaho (81.5%, a difference of 0.16%), Choctaw (81.4%, a difference of 0.23%), and Shoshone (81.4%, a difference of 0.24%).
| Demographics | Rating | Rank | In Labor Force | Age 30-34 |
| Puget Sound Salish | 0.0 /100 | #308 | Tragic 82.1% |
| Immigrants | Mexico | 0.0 /100 | #309 | Tragic 82.0% |
| Cajuns | 0.0 /100 | #310 | Tragic 82.0% |
| Chickasaw | 0.0 /100 | #311 | Tragic 81.9% |
| Mexicans | 0.0 /100 | #312 | Tragic 81.9% |
| Iroquois | 0.0 /100 | #313 | Tragic 81.9% |
| Alaskan Athabascans | 0.0 /100 | #314 | Tragic 81.7% |
| Cherokee | 0.0 /100 | #315 | Tragic 81.6% |
| Immigrants | Azores | 0.0 /100 | #316 | Tragic 81.5% |
| Arapaho | 0.0 /100 | #317 | Tragic 81.5% |
| Choctaw | 0.0 /100 | #318 | Tragic 81.4% |
| Shoshone | 0.0 /100 | #319 | Tragic 81.4% |
| Yaqui | 0.0 /100 | #320 | Tragic 81.4% |
| Alaska Natives | 0.0 /100 | #321 | Tragic 81.3% |
| Puerto Ricans | 0.0 /100 | #322 | Tragic 81.2% |
Demographics Similar to Immigrants from Ecuador by In Labor Force | Age 30-34
In terms of in labor force | age 30-34, the demographic groups most similar to Immigrants from Ecuador are Immigrants from Germany (84.3%, a difference of 0.0%), European (84.3%, a difference of 0.0%), Immigrants from Trinidad and Tobago (84.3%, a difference of 0.0%), Immigrants from Jamaica (84.3%, a difference of 0.020%), and Immigrants from Panama (84.3%, a difference of 0.020%).
| Demographics | Rating | Rank | In Labor Force | Age 30-34 |
| Jamaicans | 8.8 /100 | #209 | Tragic 84.3% |
| Indonesians | 8.8 /100 | #210 | Tragic 84.3% |
| Japanese | 8.8 /100 | #211 | Tragic 84.3% |
| Immigrants | Western Asia | 8.2 /100 | #212 | Tragic 84.3% |
| Immigrants | Jamaica | 7.9 /100 | #213 | Tragic 84.3% |
| Immigrants | Germany | 7.2 /100 | #214 | Tragic 84.3% |
| Europeans | 7.2 /100 | #215 | Tragic 84.3% |
| Immigrants | Ecuador | 7.1 /100 | #216 | Tragic 84.3% |
| Immigrants | Trinidad and Tobago | 7.0 /100 | #217 | Tragic 84.3% |
| Immigrants | Panama | 6.3 /100 | #218 | Tragic 84.3% |
| Swiss | 5.8 /100 | #219 | Tragic 84.3% |
| Danes | 5.3 /100 | #220 | Tragic 84.3% |
| Salvadorans | 3.8 /100 | #221 | Tragic 84.2% |
| Panamanians | 3.8 /100 | #222 | Tragic 84.2% |
| Immigrants | Laos | 3.6 /100 | #223 | Tragic 84.2% |