Immigrants from Somalia vs Immigrants from Ecuador In Labor Force | Age 30-34
COMPARE
Immigrants from Somalia
Immigrants from Ecuador
In Labor Force | Age 30-34
In Labor Force | Age 30-34 Comparison
Immigrants from Somalia
Immigrants from Ecuador
86.2%
IN LABOR FORCE | AGE 30-34
100.0/ 100
METRIC RATING
9th/ 347
METRIC RANK
84.3%
IN LABOR FORCE | AGE 30-34
7.1/ 100
METRIC RATING
216th/ 347
METRIC RANK
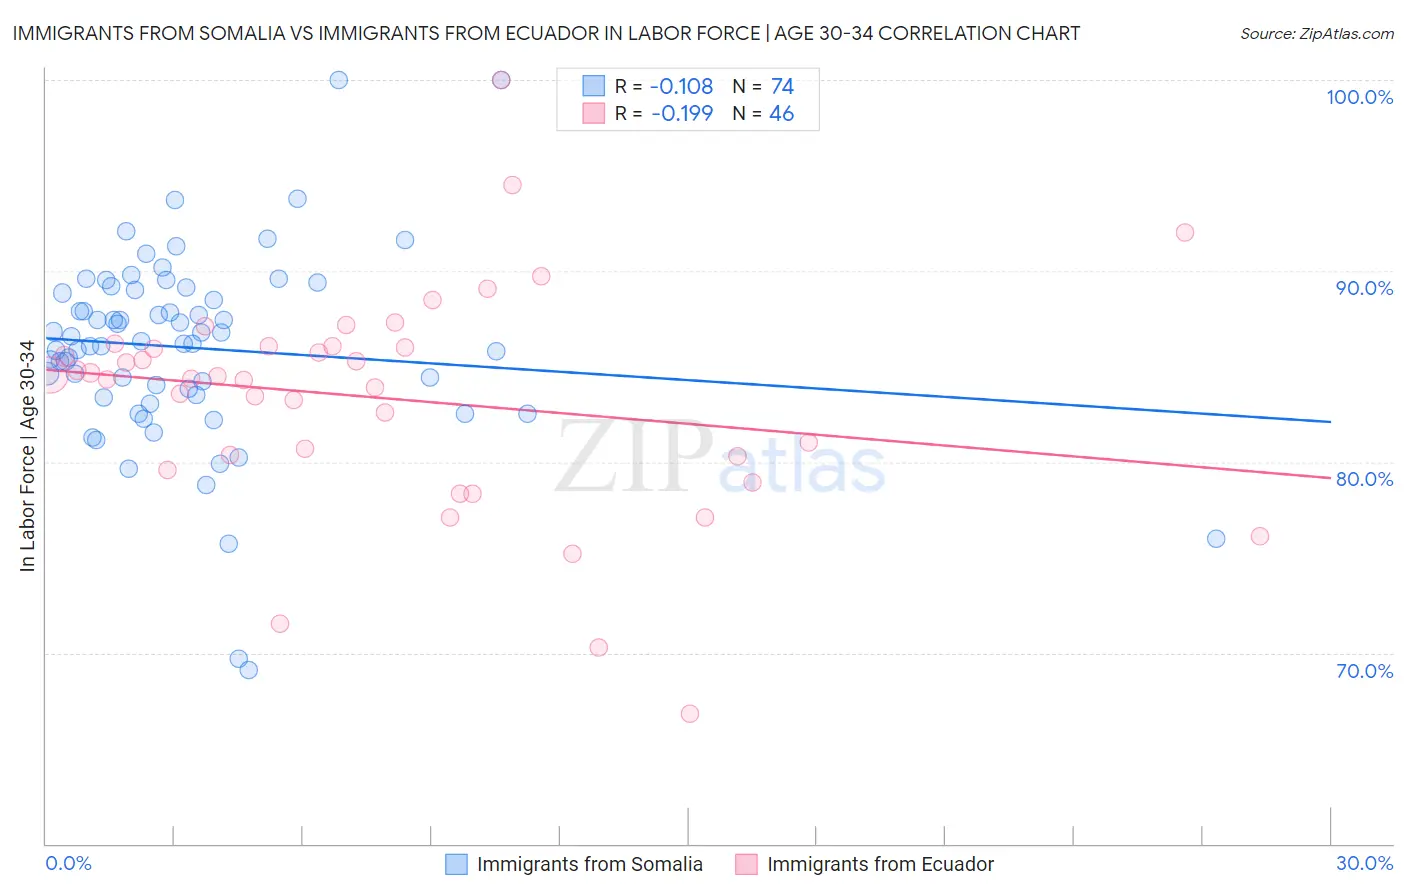
Immigrants from Somalia vs Immigrants from Ecuador In Labor Force | Age 30-34 Correlation Chart
The statistical analysis conducted on geographies consisting of 92,106,685 people shows a poor negative correlation between the proportion of Immigrants from Somalia and labor force participation rate among population between the ages 30 and 34 in the United States with a correlation coefficient (R) of -0.108 and weighted average of 86.2%. Similarly, the statistical analysis conducted on geographies consisting of 270,923,520 people shows a poor negative correlation between the proportion of Immigrants from Ecuador and labor force participation rate among population between the ages 30 and 34 in the United States with a correlation coefficient (R) of -0.199 and weighted average of 84.3%, a difference of 2.3%.
In Labor Force | Age 30-34 Correlation Summary
| Measurement | Immigrants from Somalia | Immigrants from Ecuador |
| Minimum | 69.1% | 66.8% |
| Maximum | 100.0% | 100.0% |
| Range | 30.9% | 33.2% |
| Mean | 86.0% | 83.3% |
| Median | 86.3% | 84.5% |
| Interquartile 25% (IQ1) | 83.5% | 80.3% |
| Interquartile 75% (IQ3) | 89.0% | 86.1% |
| Interquartile Range (IQR) | 5.5% | 5.8% |
| Standard Deviation (Sample) | 5.1% | 5.9% |
| Standard Deviation (Population) | 5.1% | 5.9% |
Similar Demographics by In Labor Force | Age 30-34
Demographics Similar to Immigrants from Somalia by In Labor Force | Age 30-34
In terms of in labor force | age 30-34, the demographic groups most similar to Immigrants from Somalia are Cambodian (86.2%, a difference of 0.010%), Immigrants from Bolivia (86.2%, a difference of 0.020%), Somali (86.2%, a difference of 0.040%), Immigrants from Serbia (86.2%, a difference of 0.040%), and Carpatho Rusyn (86.2%, a difference of 0.040%).
| Demographics | Rating | Rank | In Labor Force | Age 30-34 |
| Ethiopians | 100.0 /100 | #2 | Exceptional 86.6% |
| Immigrants | Ethiopia | 100.0 /100 | #3 | Exceptional 86.6% |
| Liberians | 100.0 /100 | #4 | Exceptional 86.4% |
| Immigrants | Ireland | 100.0 /100 | #5 | Exceptional 86.3% |
| Somalis | 100.0 /100 | #6 | Exceptional 86.2% |
| Immigrants | Bolivia | 100.0 /100 | #7 | Exceptional 86.2% |
| Cambodians | 100.0 /100 | #8 | Exceptional 86.2% |
| Immigrants | Somalia | 100.0 /100 | #9 | Exceptional 86.2% |
| Immigrants | Serbia | 100.0 /100 | #10 | Exceptional 86.2% |
| Carpatho Rusyns | 100.0 /100 | #11 | Exceptional 86.2% |
| Bolivians | 100.0 /100 | #12 | Exceptional 86.1% |
| Immigrants | Croatia | 100.0 /100 | #13 | Exceptional 86.1% |
| Immigrants | Cabo Verde | 100.0 /100 | #14 | Exceptional 86.1% |
| Immigrants | Albania | 100.0 /100 | #15 | Exceptional 86.1% |
| Latvians | 100.0 /100 | #16 | Exceptional 86.0% |
Demographics Similar to Immigrants from Ecuador by In Labor Force | Age 30-34
In terms of in labor force | age 30-34, the demographic groups most similar to Immigrants from Ecuador are Immigrants from Germany (84.3%, a difference of 0.0%), European (84.3%, a difference of 0.0%), Immigrants from Trinidad and Tobago (84.3%, a difference of 0.0%), Immigrants from Jamaica (84.3%, a difference of 0.020%), and Immigrants from Panama (84.3%, a difference of 0.020%).
| Demographics | Rating | Rank | In Labor Force | Age 30-34 |
| Jamaicans | 8.8 /100 | #209 | Tragic 84.3% |
| Indonesians | 8.8 /100 | #210 | Tragic 84.3% |
| Japanese | 8.8 /100 | #211 | Tragic 84.3% |
| Immigrants | Western Asia | 8.2 /100 | #212 | Tragic 84.3% |
| Immigrants | Jamaica | 7.9 /100 | #213 | Tragic 84.3% |
| Immigrants | Germany | 7.2 /100 | #214 | Tragic 84.3% |
| Europeans | 7.2 /100 | #215 | Tragic 84.3% |
| Immigrants | Ecuador | 7.1 /100 | #216 | Tragic 84.3% |
| Immigrants | Trinidad and Tobago | 7.0 /100 | #217 | Tragic 84.3% |
| Immigrants | Panama | 6.3 /100 | #218 | Tragic 84.3% |
| Swiss | 5.8 /100 | #219 | Tragic 84.3% |
| Danes | 5.3 /100 | #220 | Tragic 84.3% |
| Salvadorans | 3.8 /100 | #221 | Tragic 84.2% |
| Panamanians | 3.8 /100 | #222 | Tragic 84.2% |
| Immigrants | Laos | 3.6 /100 | #223 | Tragic 84.2% |