Cherokee vs Immigrants from Ecuador Single Mother Households
COMPARE
Cherokee
Immigrants from Ecuador
Single Mother Households
Single Mother Households Comparison
Cherokee
Immigrants from Ecuador
6.8%
SINGLE MOTHER HOUSEHOLDS
5.1/ 100
METRIC RATING
216th/ 347
METRIC RANK
7.3%
SINGLE MOTHER HOUSEHOLDS
0.3/ 100
METRIC RATING
254th/ 347
METRIC RANK
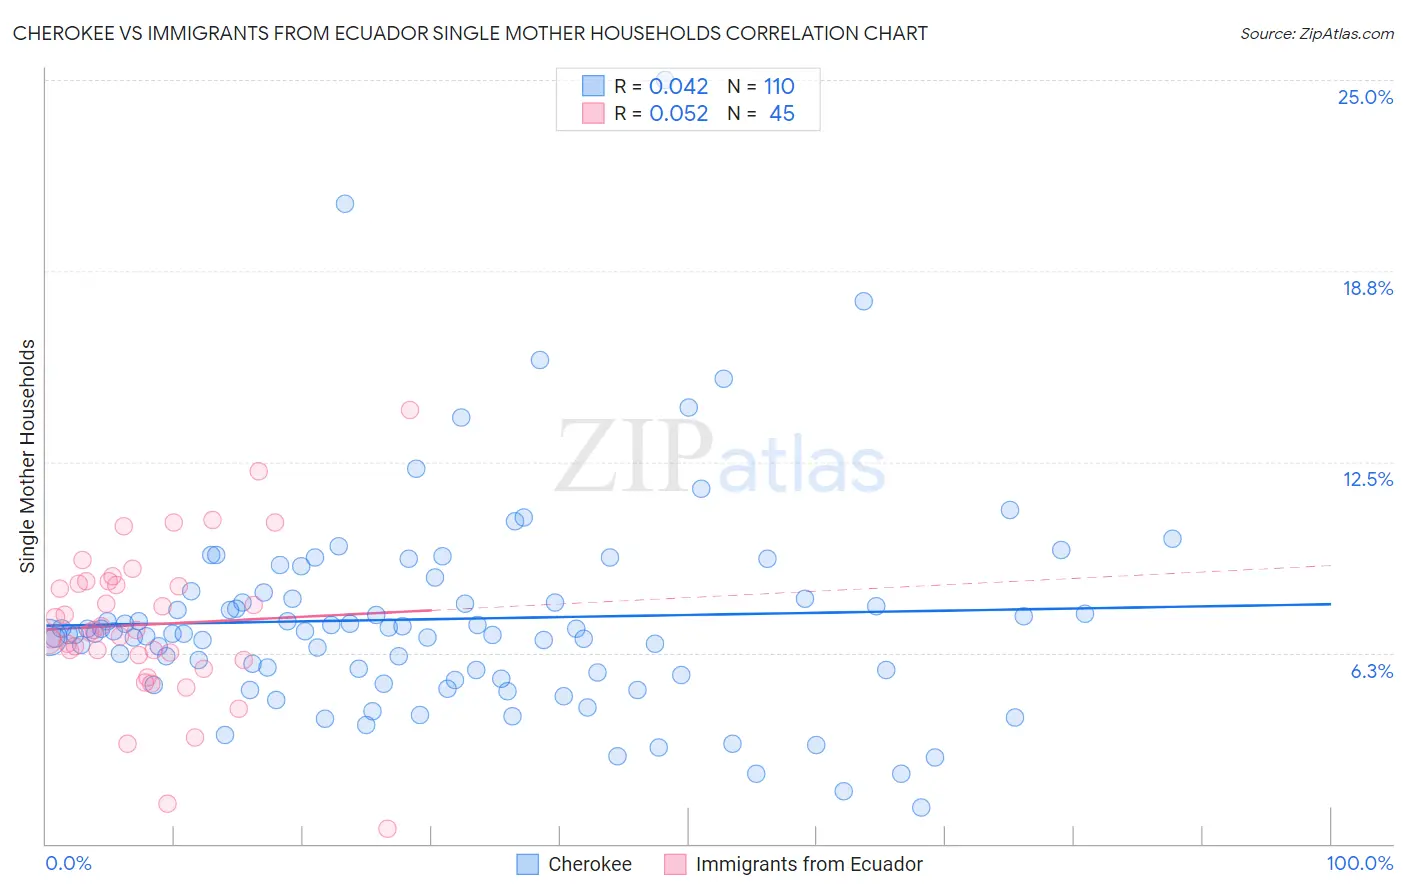
Cherokee vs Immigrants from Ecuador Single Mother Households Correlation Chart
The statistical analysis conducted on geographies consisting of 491,457,452 people shows no correlation between the proportion of Cherokee and percentage of single mother households in the United States with a correlation coefficient (R) of 0.042 and weighted average of 6.8%. Similarly, the statistical analysis conducted on geographies consisting of 270,615,585 people shows a slight positive correlation between the proportion of Immigrants from Ecuador and percentage of single mother households in the United States with a correlation coefficient (R) of 0.052 and weighted average of 7.3%, a difference of 7.7%.
Single Mother Households Correlation Summary
| Measurement | Cherokee | Immigrants from Ecuador |
| Minimum | 1.2% | 0.47% |
| Maximum | 25.0% | 14.2% |
| Range | 23.8% | 13.7% |
| Mean | 7.4% | 7.2% |
| Median | 6.9% | 7.0% |
| Interquartile 25% (IQ1) | 5.5% | 6.1% |
| Interquartile 75% (IQ3) | 8.0% | 8.5% |
| Interquartile Range (IQR) | 2.5% | 2.5% |
| Standard Deviation (Sample) | 3.5% | 2.5% |
| Standard Deviation (Population) | 3.5% | 2.5% |
Similar Demographics by Single Mother Households
Demographics Similar to Cherokee by Single Mother Households
In terms of single mother households, the demographic groups most similar to Cherokee are Aleut (6.8%, a difference of 0.14%), Shoshone (6.8%, a difference of 0.29%), Immigrants from Eastern Africa (6.8%, a difference of 0.36%), Immigrants (6.8%, a difference of 0.44%), and Immigrants from Thailand (6.9%, a difference of 0.63%).
| Demographics | Rating | Rank | Single Mother Households |
| Immigrants | Colombia | 10.5 /100 | #209 | Poor 6.7% |
| Immigrants | Nonimmigrants | 10.4 /100 | #210 | Poor 6.7% |
| Immigrants | Venezuela | 8.5 /100 | #211 | Tragic 6.7% |
| Immigrants | Eritrea | 8.4 /100 | #212 | Tragic 6.7% |
| Immigrants | Costa Rica | 8.2 /100 | #213 | Tragic 6.7% |
| Immigrants | Uruguay | 7.9 /100 | #214 | Tragic 6.7% |
| Shoshone | 5.7 /100 | #215 | Tragic 6.8% |
| Cherokee | 5.1 /100 | #216 | Tragic 6.8% |
| Aleuts | 4.8 /100 | #217 | Tragic 6.8% |
| Immigrants | Eastern Africa | 4.4 /100 | #218 | Tragic 6.8% |
| Immigrants | Immigrants | 4.3 /100 | #219 | Tragic 6.8% |
| Immigrants | Thailand | 4.0 /100 | #220 | Tragic 6.9% |
| French American Indians | 3.7 /100 | #221 | Tragic 6.9% |
| Immigrants | Bangladesh | 3.7 /100 | #222 | Tragic 6.9% |
| Immigrants | Micronesia | 3.6 /100 | #223 | Tragic 6.9% |
Demographics Similar to Immigrants from Ecuador by Single Mother Households
In terms of single mother households, the demographic groups most similar to Immigrants from Ecuador are Cajun (7.3%, a difference of 0.050%), Mexican American Indian (7.4%, a difference of 0.37%), Alaskan Athabascan (7.3%, a difference of 0.44%), Malaysian (7.3%, a difference of 0.46%), and Seminole (7.4%, a difference of 0.73%).
| Demographics | Rating | Rank | Single Mother Households |
| Dutch West Indians | 0.4 /100 | #247 | Tragic 7.3% |
| Spanish American Indians | 0.4 /100 | #248 | Tragic 7.3% |
| Bermudans | 0.4 /100 | #249 | Tragic 7.3% |
| Immigrants | Africa | 0.4 /100 | #250 | Tragic 7.3% |
| Malaysians | 0.3 /100 | #251 | Tragic 7.3% |
| Alaskan Athabascans | 0.3 /100 | #252 | Tragic 7.3% |
| Cajuns | 0.3 /100 | #253 | Tragic 7.3% |
| Immigrants | Ecuador | 0.3 /100 | #254 | Tragic 7.3% |
| Mexican American Indians | 0.2 /100 | #255 | Tragic 7.4% |
| Seminole | 0.2 /100 | #256 | Tragic 7.4% |
| Alaska Natives | 0.2 /100 | #257 | Tragic 7.4% |
| Pueblo | 0.2 /100 | #258 | Tragic 7.4% |
| Immigrants | Yemen | 0.2 /100 | #259 | Tragic 7.4% |
| Immigrants | Zaire | 0.2 /100 | #260 | Tragic 7.4% |
| Japanese | 0.2 /100 | #261 | Tragic 7.4% |