Cherokee vs Immigrants from Ethiopia In Labor Force | Age 30-34
COMPARE
Cherokee
Immigrants from Ethiopia
In Labor Force | Age 30-34
In Labor Force | Age 30-34 Comparison
Cherokee
Immigrants from Ethiopia
81.6%
IN LABOR FORCE | AGE 30-34
0.0/ 100
METRIC RATING
315th/ 347
METRIC RANK
86.6%
IN LABOR FORCE | AGE 30-34
100.0/ 100
METRIC RATING
3rd/ 347
METRIC RANK
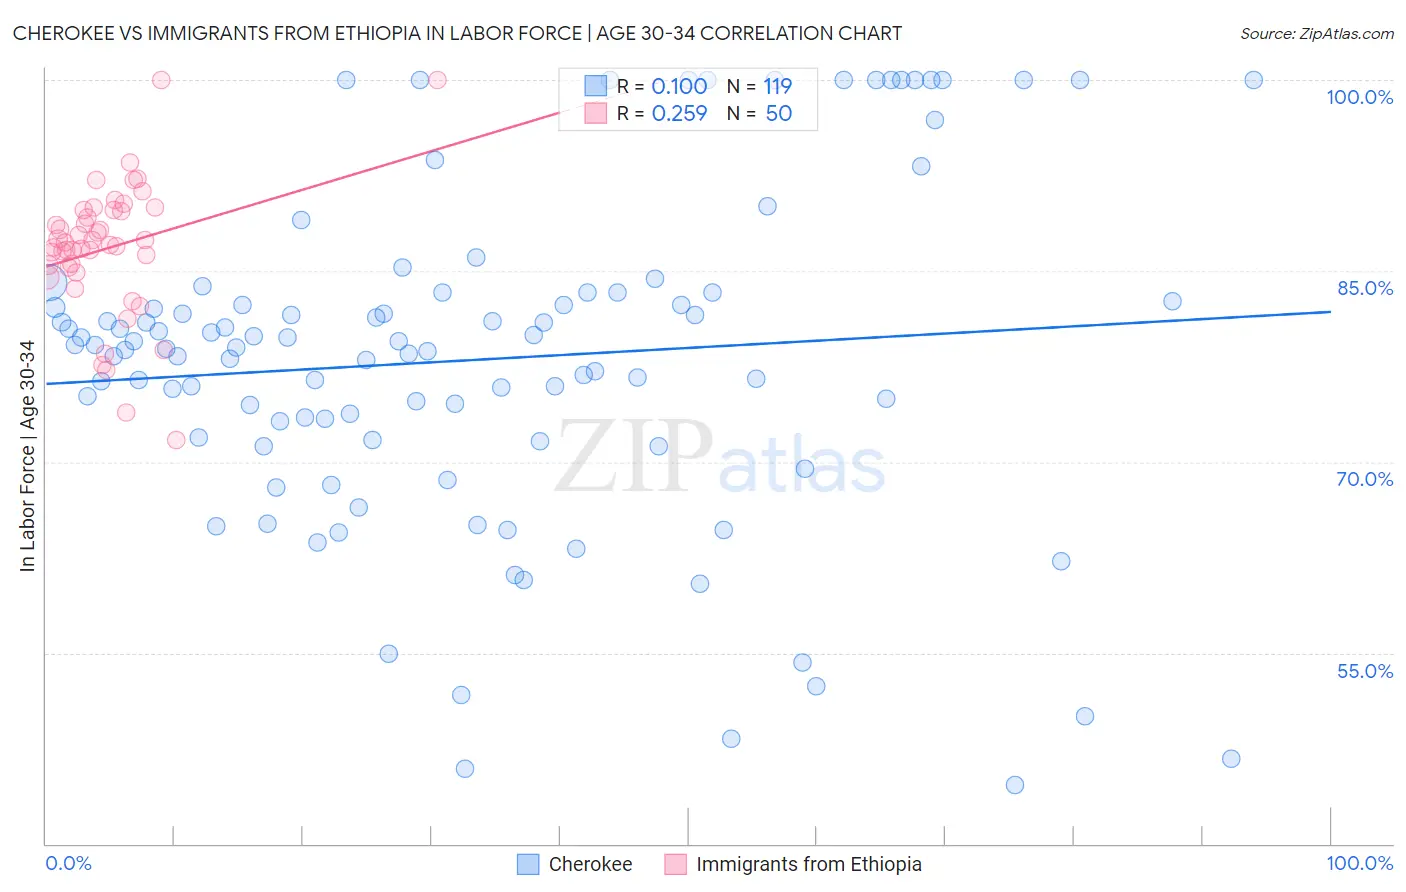
Cherokee vs Immigrants from Ethiopia In Labor Force | Age 30-34 Correlation Chart
The statistical analysis conducted on geographies consisting of 493,185,438 people shows a poor positive correlation between the proportion of Cherokee and labor force participation rate among population between the ages 30 and 34 in the United States with a correlation coefficient (R) of 0.100 and weighted average of 81.6%. Similarly, the statistical analysis conducted on geographies consisting of 211,483,251 people shows a weak positive correlation between the proportion of Immigrants from Ethiopia and labor force participation rate among population between the ages 30 and 34 in the United States with a correlation coefficient (R) of 0.259 and weighted average of 86.6%, a difference of 6.1%.
In Labor Force | Age 30-34 Correlation Summary
| Measurement | Cherokee | Immigrants from Ethiopia |
| Minimum | 44.6% | 71.7% |
| Maximum | 100.0% | 100.0% |
| Range | 55.4% | 28.3% |
| Mean | 78.0% | 86.8% |
| Median | 79.0% | 87.1% |
| Interquartile 25% (IQ1) | 71.7% | 85.2% |
| Interquartile 75% (IQ3) | 83.3% | 89.8% |
| Interquartile Range (IQR) | 11.6% | 4.6% |
| Standard Deviation (Sample) | 13.1% | 5.3% |
| Standard Deviation (Population) | 13.0% | 5.3% |
Similar Demographics by In Labor Force | Age 30-34
Demographics Similar to Cherokee by In Labor Force | Age 30-34
In terms of in labor force | age 30-34, the demographic groups most similar to Cherokee are Alaskan Athabascan (81.7%, a difference of 0.10%), Immigrants from the Azores (81.5%, a difference of 0.15%), Arapaho (81.5%, a difference of 0.16%), Choctaw (81.4%, a difference of 0.23%), and Shoshone (81.4%, a difference of 0.24%).
| Demographics | Rating | Rank | In Labor Force | Age 30-34 |
| Puget Sound Salish | 0.0 /100 | #308 | Tragic 82.1% |
| Immigrants | Mexico | 0.0 /100 | #309 | Tragic 82.0% |
| Cajuns | 0.0 /100 | #310 | Tragic 82.0% |
| Chickasaw | 0.0 /100 | #311 | Tragic 81.9% |
| Mexicans | 0.0 /100 | #312 | Tragic 81.9% |
| Iroquois | 0.0 /100 | #313 | Tragic 81.9% |
| Alaskan Athabascans | 0.0 /100 | #314 | Tragic 81.7% |
| Cherokee | 0.0 /100 | #315 | Tragic 81.6% |
| Immigrants | Azores | 0.0 /100 | #316 | Tragic 81.5% |
| Arapaho | 0.0 /100 | #317 | Tragic 81.5% |
| Choctaw | 0.0 /100 | #318 | Tragic 81.4% |
| Shoshone | 0.0 /100 | #319 | Tragic 81.4% |
| Yaqui | 0.0 /100 | #320 | Tragic 81.4% |
| Alaska Natives | 0.0 /100 | #321 | Tragic 81.3% |
| Puerto Ricans | 0.0 /100 | #322 | Tragic 81.2% |
Demographics Similar to Immigrants from Ethiopia by In Labor Force | Age 30-34
In terms of in labor force | age 30-34, the demographic groups most similar to Immigrants from Ethiopia are Ethiopian (86.6%, a difference of 0.010%), Luxembourger (86.6%, a difference of 0.080%), Liberian (86.4%, a difference of 0.19%), Immigrants from Ireland (86.3%, a difference of 0.34%), and Somali (86.2%, a difference of 0.37%).
| Demographics | Rating | Rank | In Labor Force | Age 30-34 |
| Luxembourgers | 100.0 /100 | #1 | Exceptional 86.6% |
| Ethiopians | 100.0 /100 | #2 | Exceptional 86.6% |
| Immigrants | Ethiopia | 100.0 /100 | #3 | Exceptional 86.6% |
| Liberians | 100.0 /100 | #4 | Exceptional 86.4% |
| Immigrants | Ireland | 100.0 /100 | #5 | Exceptional 86.3% |
| Somalis | 100.0 /100 | #6 | Exceptional 86.2% |
| Immigrants | Bolivia | 100.0 /100 | #7 | Exceptional 86.2% |
| Cambodians | 100.0 /100 | #8 | Exceptional 86.2% |
| Immigrants | Somalia | 100.0 /100 | #9 | Exceptional 86.2% |
| Immigrants | Serbia | 100.0 /100 | #10 | Exceptional 86.2% |
| Carpatho Rusyns | 100.0 /100 | #11 | Exceptional 86.2% |
| Bolivians | 100.0 /100 | #12 | Exceptional 86.1% |
| Immigrants | Croatia | 100.0 /100 | #13 | Exceptional 86.1% |
| Immigrants | Cabo Verde | 100.0 /100 | #14 | Exceptional 86.1% |
| Immigrants | Albania | 100.0 /100 | #15 | Exceptional 86.1% |