Assyrian/Chaldean/Syriac vs Immigrants from Ecuador In Labor Force | Age 30-34
COMPARE
Assyrian/Chaldean/Syriac
Immigrants from Ecuador
In Labor Force | Age 30-34
In Labor Force | Age 30-34 Comparison
Assyrians/Chaldeans/Syriacs
Immigrants from Ecuador
83.2%
IN LABOR FORCE | AGE 30-34
0.0/ 100
METRIC RATING
283rd/ 347
METRIC RANK
84.3%
IN LABOR FORCE | AGE 30-34
7.1/ 100
METRIC RATING
216th/ 347
METRIC RANK
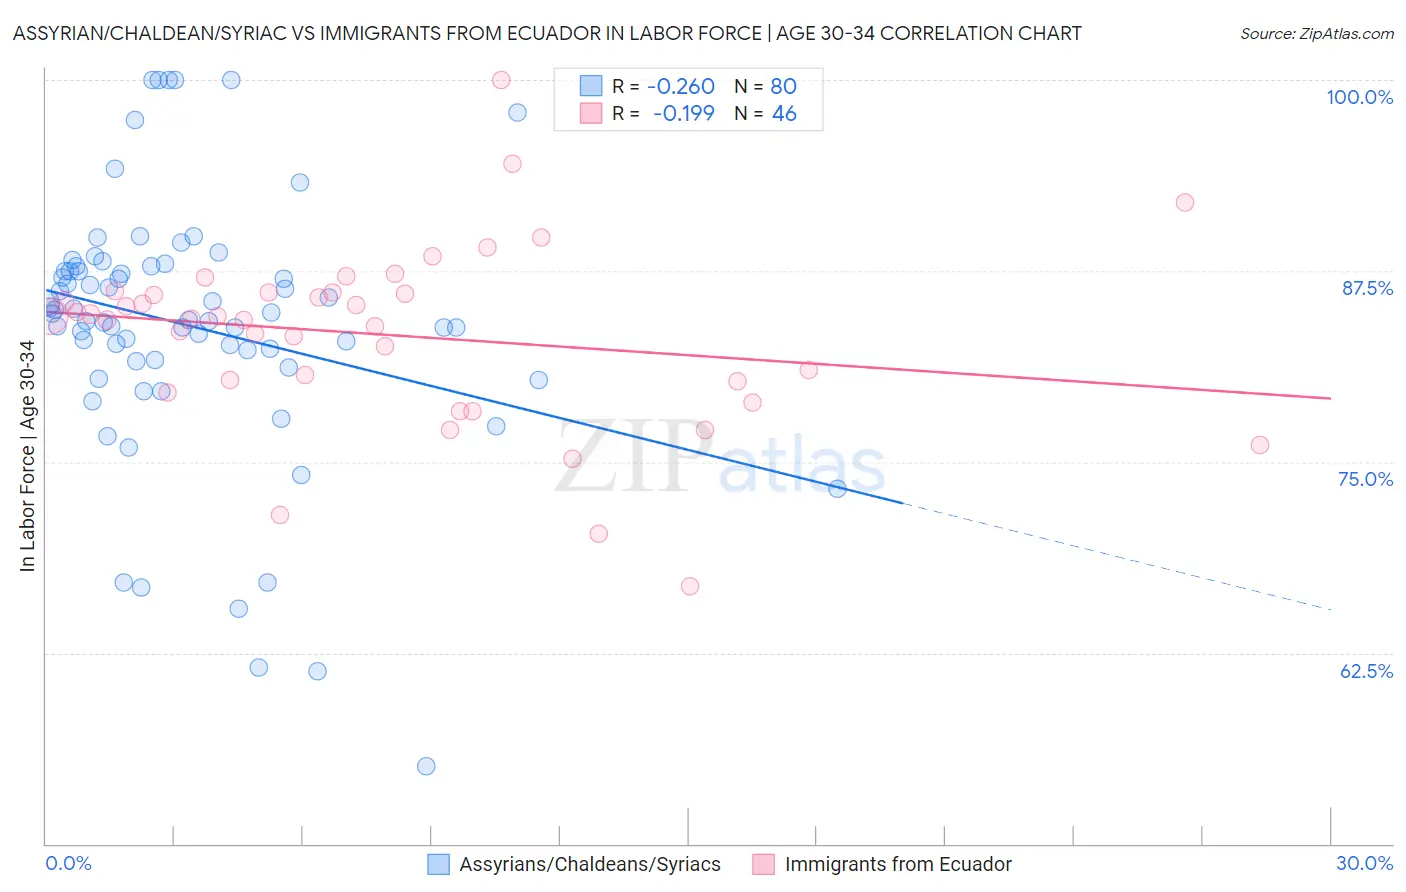
Assyrian/Chaldean/Syriac vs Immigrants from Ecuador In Labor Force | Age 30-34 Correlation Chart
The statistical analysis conducted on geographies consisting of 110,308,320 people shows a weak negative correlation between the proportion of Assyrians/Chaldeans/Syriacs and labor force participation rate among population between the ages 30 and 34 in the United States with a correlation coefficient (R) of -0.260 and weighted average of 83.2%. Similarly, the statistical analysis conducted on geographies consisting of 270,923,520 people shows a poor negative correlation between the proportion of Immigrants from Ecuador and labor force participation rate among population between the ages 30 and 34 in the United States with a correlation coefficient (R) of -0.199 and weighted average of 84.3%, a difference of 1.3%.
In Labor Force | Age 30-34 Correlation Summary
| Measurement | Assyrian/Chaldean/Syriac | Immigrants from Ecuador |
| Minimum | 55.1% | 66.8% |
| Maximum | 100.0% | 100.0% |
| Range | 44.9% | 33.2% |
| Mean | 83.9% | 83.3% |
| Median | 84.5% | 84.5% |
| Interquartile 25% (IQ1) | 81.7% | 80.3% |
| Interquartile 75% (IQ3) | 87.7% | 86.1% |
| Interquartile Range (IQR) | 6.0% | 5.8% |
| Standard Deviation (Sample) | 8.6% | 5.9% |
| Standard Deviation (Population) | 8.5% | 5.9% |
Similar Demographics by In Labor Force | Age 30-34
Demographics Similar to Assyrians/Chaldeans/Syriacs by In Labor Force | Age 30-34
In terms of in labor force | age 30-34, the demographic groups most similar to Assyrians/Chaldeans/Syriacs are Mexican American Indian (83.2%, a difference of 0.010%), Samoan (83.3%, a difference of 0.050%), Immigrants from Belize (83.2%, a difference of 0.050%), Cree (83.2%, a difference of 0.050%), and Immigrants from Latin America (83.1%, a difference of 0.11%).
| Demographics | Rating | Rank | In Labor Force | Age 30-34 |
| Tongans | 0.0 /100 | #276 | Tragic 83.5% |
| Delaware | 0.0 /100 | #277 | Tragic 83.5% |
| Fijians | 0.0 /100 | #278 | Tragic 83.4% |
| Immigrants | Fiji | 0.0 /100 | #279 | Tragic 83.4% |
| Africans | 0.0 /100 | #280 | Tragic 83.4% |
| Samoans | 0.0 /100 | #281 | Tragic 83.3% |
| Mexican American Indians | 0.0 /100 | #282 | Tragic 83.2% |
| Assyrians/Chaldeans/Syriacs | 0.0 /100 | #283 | Tragic 83.2% |
| Immigrants | Belize | 0.0 /100 | #284 | Tragic 83.2% |
| Cree | 0.0 /100 | #285 | Tragic 83.2% |
| Immigrants | Latin America | 0.0 /100 | #286 | Tragic 83.1% |
| Native Hawaiians | 0.0 /100 | #287 | Tragic 83.0% |
| Central American Indians | 0.0 /100 | #288 | Tragic 83.0% |
| Hawaiians | 0.0 /100 | #289 | Tragic 83.0% |
| Blackfeet | 0.0 /100 | #290 | Tragic 82.8% |
Demographics Similar to Immigrants from Ecuador by In Labor Force | Age 30-34
In terms of in labor force | age 30-34, the demographic groups most similar to Immigrants from Ecuador are Immigrants from Germany (84.3%, a difference of 0.0%), European (84.3%, a difference of 0.0%), Immigrants from Trinidad and Tobago (84.3%, a difference of 0.0%), Immigrants from Jamaica (84.3%, a difference of 0.020%), and Immigrants from Panama (84.3%, a difference of 0.020%).
| Demographics | Rating | Rank | In Labor Force | Age 30-34 |
| Jamaicans | 8.8 /100 | #209 | Tragic 84.3% |
| Indonesians | 8.8 /100 | #210 | Tragic 84.3% |
| Japanese | 8.8 /100 | #211 | Tragic 84.3% |
| Immigrants | Western Asia | 8.2 /100 | #212 | Tragic 84.3% |
| Immigrants | Jamaica | 7.9 /100 | #213 | Tragic 84.3% |
| Immigrants | Germany | 7.2 /100 | #214 | Tragic 84.3% |
| Europeans | 7.2 /100 | #215 | Tragic 84.3% |
| Immigrants | Ecuador | 7.1 /100 | #216 | Tragic 84.3% |
| Immigrants | Trinidad and Tobago | 7.0 /100 | #217 | Tragic 84.3% |
| Immigrants | Panama | 6.3 /100 | #218 | Tragic 84.3% |
| Swiss | 5.8 /100 | #219 | Tragic 84.3% |
| Danes | 5.3 /100 | #220 | Tragic 84.3% |
| Salvadorans | 3.8 /100 | #221 | Tragic 84.2% |
| Panamanians | 3.8 /100 | #222 | Tragic 84.2% |
| Immigrants | Laos | 3.6 /100 | #223 | Tragic 84.2% |