Laotian vs Immigrants from Ecuador In Labor Force | Age 30-34
COMPARE
Laotian
Immigrants from Ecuador
In Labor Force | Age 30-34
In Labor Force | Age 30-34 Comparison
Laotians
Immigrants from Ecuador
84.7%
IN LABOR FORCE | AGE 30-34
46.9/ 100
METRIC RATING
177th/ 347
METRIC RANK
84.3%
IN LABOR FORCE | AGE 30-34
7.1/ 100
METRIC RATING
216th/ 347
METRIC RANK
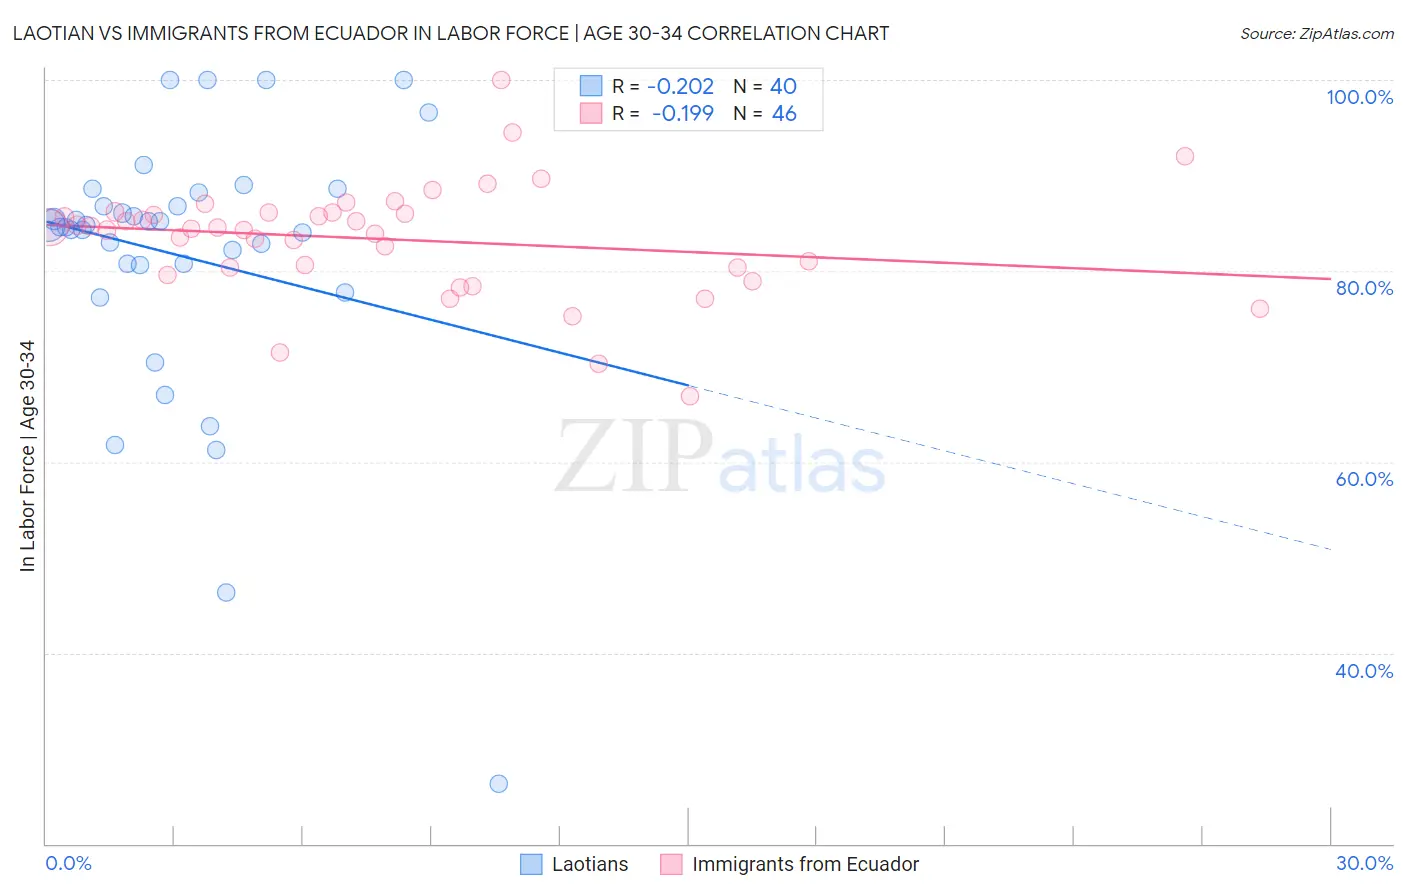
Laotian vs Immigrants from Ecuador In Labor Force | Age 30-34 Correlation Chart
The statistical analysis conducted on geographies consisting of 224,759,127 people shows a weak negative correlation between the proportion of Laotians and labor force participation rate among population between the ages 30 and 34 in the United States with a correlation coefficient (R) of -0.202 and weighted average of 84.7%. Similarly, the statistical analysis conducted on geographies consisting of 270,923,520 people shows a poor negative correlation between the proportion of Immigrants from Ecuador and labor force participation rate among population between the ages 30 and 34 in the United States with a correlation coefficient (R) of -0.199 and weighted average of 84.3%, a difference of 0.43%.
In Labor Force | Age 30-34 Correlation Summary
| Measurement | Laotian | Immigrants from Ecuador |
| Minimum | 26.3% | 66.8% |
| Maximum | 100.0% | 100.0% |
| Range | 73.7% | 33.2% |
| Mean | 81.6% | 83.3% |
| Median | 84.7% | 84.5% |
| Interquartile 25% (IQ1) | 80.7% | 80.3% |
| Interquartile 75% (IQ3) | 87.5% | 86.1% |
| Interquartile Range (IQR) | 6.8% | 5.8% |
| Standard Deviation (Sample) | 14.2% | 5.9% |
| Standard Deviation (Population) | 14.0% | 5.9% |
Similar Demographics by In Labor Force | Age 30-34
Demographics Similar to Laotians by In Labor Force | Age 30-34
In terms of in labor force | age 30-34, the demographic groups most similar to Laotians are Finnish (84.7%, a difference of 0.020%), Immigrants from South America (84.7%, a difference of 0.020%), Immigrants from Uzbekistan (84.7%, a difference of 0.020%), Okinawan (84.6%, a difference of 0.020%), and Immigrants from England (84.7%, a difference of 0.030%).
| Demographics | Rating | Rank | In Labor Force | Age 30-34 |
| Immigrants | Burma/Myanmar | 52.0 /100 | #170 | Average 84.7% |
| Irish | 52.0 /100 | #171 | Average 84.7% |
| Immigrants | England | 51.7 /100 | #172 | Average 84.7% |
| Israelis | 51.1 /100 | #173 | Average 84.7% |
| Finns | 50.0 /100 | #174 | Average 84.7% |
| Immigrants | South America | 50.0 /100 | #175 | Average 84.7% |
| Immigrants | Uzbekistan | 49.1 /100 | #176 | Average 84.7% |
| Laotians | 46.9 /100 | #177 | Average 84.7% |
| Okinawans | 44.1 /100 | #178 | Average 84.6% |
| Immigrants | Nigeria | 42.5 /100 | #179 | Average 84.6% |
| Immigrants | Netherlands | 42.1 /100 | #180 | Average 84.6% |
| Moroccans | 40.3 /100 | #181 | Average 84.6% |
| Barbadians | 36.7 /100 | #182 | Fair 84.6% |
| Immigrants | Canada | 35.0 /100 | #183 | Fair 84.6% |
| Immigrants | North America | 33.3 /100 | #184 | Fair 84.6% |
Demographics Similar to Immigrants from Ecuador by In Labor Force | Age 30-34
In terms of in labor force | age 30-34, the demographic groups most similar to Immigrants from Ecuador are Immigrants from Germany (84.3%, a difference of 0.0%), European (84.3%, a difference of 0.0%), Immigrants from Trinidad and Tobago (84.3%, a difference of 0.0%), Immigrants from Jamaica (84.3%, a difference of 0.020%), and Immigrants from Panama (84.3%, a difference of 0.020%).
| Demographics | Rating | Rank | In Labor Force | Age 30-34 |
| Jamaicans | 8.8 /100 | #209 | Tragic 84.3% |
| Indonesians | 8.8 /100 | #210 | Tragic 84.3% |
| Japanese | 8.8 /100 | #211 | Tragic 84.3% |
| Immigrants | Western Asia | 8.2 /100 | #212 | Tragic 84.3% |
| Immigrants | Jamaica | 7.9 /100 | #213 | Tragic 84.3% |
| Immigrants | Germany | 7.2 /100 | #214 | Tragic 84.3% |
| Europeans | 7.2 /100 | #215 | Tragic 84.3% |
| Immigrants | Ecuador | 7.1 /100 | #216 | Tragic 84.3% |
| Immigrants | Trinidad and Tobago | 7.0 /100 | #217 | Tragic 84.3% |
| Immigrants | Panama | 6.3 /100 | #218 | Tragic 84.3% |
| Swiss | 5.8 /100 | #219 | Tragic 84.3% |
| Danes | 5.3 /100 | #220 | Tragic 84.3% |
| Salvadorans | 3.8 /100 | #221 | Tragic 84.2% |
| Panamanians | 3.8 /100 | #222 | Tragic 84.2% |
| Immigrants | Laos | 3.6 /100 | #223 | Tragic 84.2% |