Pueblo vs Immigrants from Ecuador In Labor Force | Age 30-34
COMPARE
Pueblo
Immigrants from Ecuador
In Labor Force | Age 30-34
In Labor Force | Age 30-34 Comparison
Pueblo
Immigrants from Ecuador
80.0%
IN LABOR FORCE | AGE 30-34
0.0/ 100
METRIC RATING
330th/ 347
METRIC RANK
84.3%
IN LABOR FORCE | AGE 30-34
7.1/ 100
METRIC RATING
216th/ 347
METRIC RANK
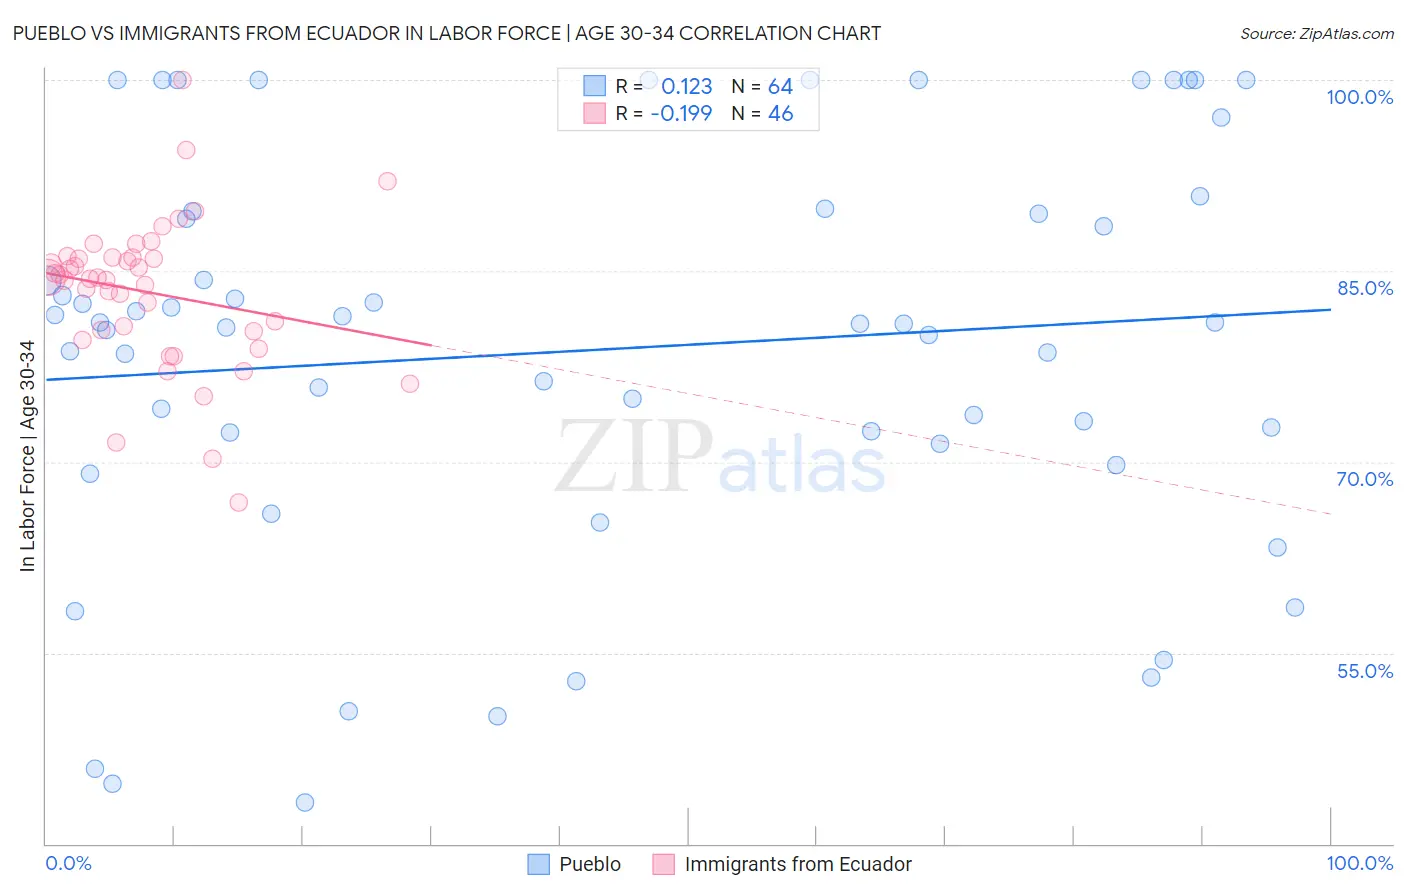
Pueblo vs Immigrants from Ecuador In Labor Force | Age 30-34 Correlation Chart
The statistical analysis conducted on geographies consisting of 120,059,209 people shows a poor positive correlation between the proportion of Pueblo and labor force participation rate among population between the ages 30 and 34 in the United States with a correlation coefficient (R) of 0.123 and weighted average of 80.0%. Similarly, the statistical analysis conducted on geographies consisting of 270,923,520 people shows a poor negative correlation between the proportion of Immigrants from Ecuador and labor force participation rate among population between the ages 30 and 34 in the United States with a correlation coefficient (R) of -0.199 and weighted average of 84.3%, a difference of 5.3%.
In Labor Force | Age 30-34 Correlation Summary
| Measurement | Pueblo | Immigrants from Ecuador |
| Minimum | 43.2% | 66.8% |
| Maximum | 100.0% | 100.0% |
| Range | 56.8% | 33.2% |
| Mean | 78.8% | 83.3% |
| Median | 80.9% | 84.5% |
| Interquartile 25% (IQ1) | 71.9% | 80.3% |
| Interquartile 75% (IQ3) | 89.6% | 86.1% |
| Interquartile Range (IQR) | 17.8% | 5.8% |
| Standard Deviation (Sample) | 15.7% | 5.9% |
| Standard Deviation (Population) | 15.6% | 5.9% |
Similar Demographics by In Labor Force | Age 30-34
Demographics Similar to Pueblo by In Labor Force | Age 30-34
In terms of in labor force | age 30-34, the demographic groups most similar to Pueblo are Houma (79.9%, a difference of 0.17%), Kiowa (79.8%, a difference of 0.28%), Creek (80.4%, a difference of 0.40%), Inupiat (79.7%, a difference of 0.40%), and Sioux (80.4%, a difference of 0.41%).
| Demographics | Rating | Rank | In Labor Force | Age 30-34 |
| Paiute | 0.0 /100 | #323 | Tragic 81.2% |
| Cheyenne | 0.0 /100 | #324 | Tragic 81.1% |
| Dutch West Indians | 0.0 /100 | #325 | Tragic 81.0% |
| Seminole | 0.0 /100 | #326 | Tragic 80.8% |
| Colville | 0.0 /100 | #327 | Tragic 80.7% |
| Sioux | 0.0 /100 | #328 | Tragic 80.4% |
| Creek | 0.0 /100 | #329 | Tragic 80.4% |
| Pueblo | 0.0 /100 | #330 | Tragic 80.0% |
| Houma | 0.0 /100 | #331 | Tragic 79.9% |
| Kiowa | 0.0 /100 | #332 | Tragic 79.8% |
| Inupiat | 0.0 /100 | #333 | Tragic 79.7% |
| Hopi | 0.0 /100 | #334 | Tragic 79.3% |
| Marshallese | 0.0 /100 | #335 | Tragic 79.2% |
| Natives/Alaskans | 0.0 /100 | #336 | Tragic 79.2% |
| Yakama | 0.0 /100 | #337 | Tragic 79.1% |
Demographics Similar to Immigrants from Ecuador by In Labor Force | Age 30-34
In terms of in labor force | age 30-34, the demographic groups most similar to Immigrants from Ecuador are Immigrants from Germany (84.3%, a difference of 0.0%), European (84.3%, a difference of 0.0%), Immigrants from Trinidad and Tobago (84.3%, a difference of 0.0%), Immigrants from Jamaica (84.3%, a difference of 0.020%), and Immigrants from Panama (84.3%, a difference of 0.020%).
| Demographics | Rating | Rank | In Labor Force | Age 30-34 |
| Jamaicans | 8.8 /100 | #209 | Tragic 84.3% |
| Indonesians | 8.8 /100 | #210 | Tragic 84.3% |
| Japanese | 8.8 /100 | #211 | Tragic 84.3% |
| Immigrants | Western Asia | 8.2 /100 | #212 | Tragic 84.3% |
| Immigrants | Jamaica | 7.9 /100 | #213 | Tragic 84.3% |
| Immigrants | Germany | 7.2 /100 | #214 | Tragic 84.3% |
| Europeans | 7.2 /100 | #215 | Tragic 84.3% |
| Immigrants | Ecuador | 7.1 /100 | #216 | Tragic 84.3% |
| Immigrants | Trinidad and Tobago | 7.0 /100 | #217 | Tragic 84.3% |
| Immigrants | Panama | 6.3 /100 | #218 | Tragic 84.3% |
| Swiss | 5.8 /100 | #219 | Tragic 84.3% |
| Danes | 5.3 /100 | #220 | Tragic 84.3% |
| Salvadorans | 3.8 /100 | #221 | Tragic 84.2% |
| Panamanians | 3.8 /100 | #222 | Tragic 84.2% |
| Immigrants | Laos | 3.6 /100 | #223 | Tragic 84.2% |