Cherokee vs Immigrants from Ecuador Unemployment Among Ages 25 to 29 years
COMPARE
Cherokee
Immigrants from Ecuador
Unemployment Among Ages 25 to 29 years
Unemployment Among Ages 25 to 29 years Comparison
Cherokee
Immigrants from Ecuador
7.6%
UNEMPLOYMENT AMONG AGES 25 TO 29 YEARS
0.0/ 100
METRIC RATING
284th/ 347
METRIC RANK
7.4%
UNEMPLOYMENT AMONG AGES 25 TO 29 YEARS
0.1/ 100
METRIC RATING
268th/ 347
METRIC RANK
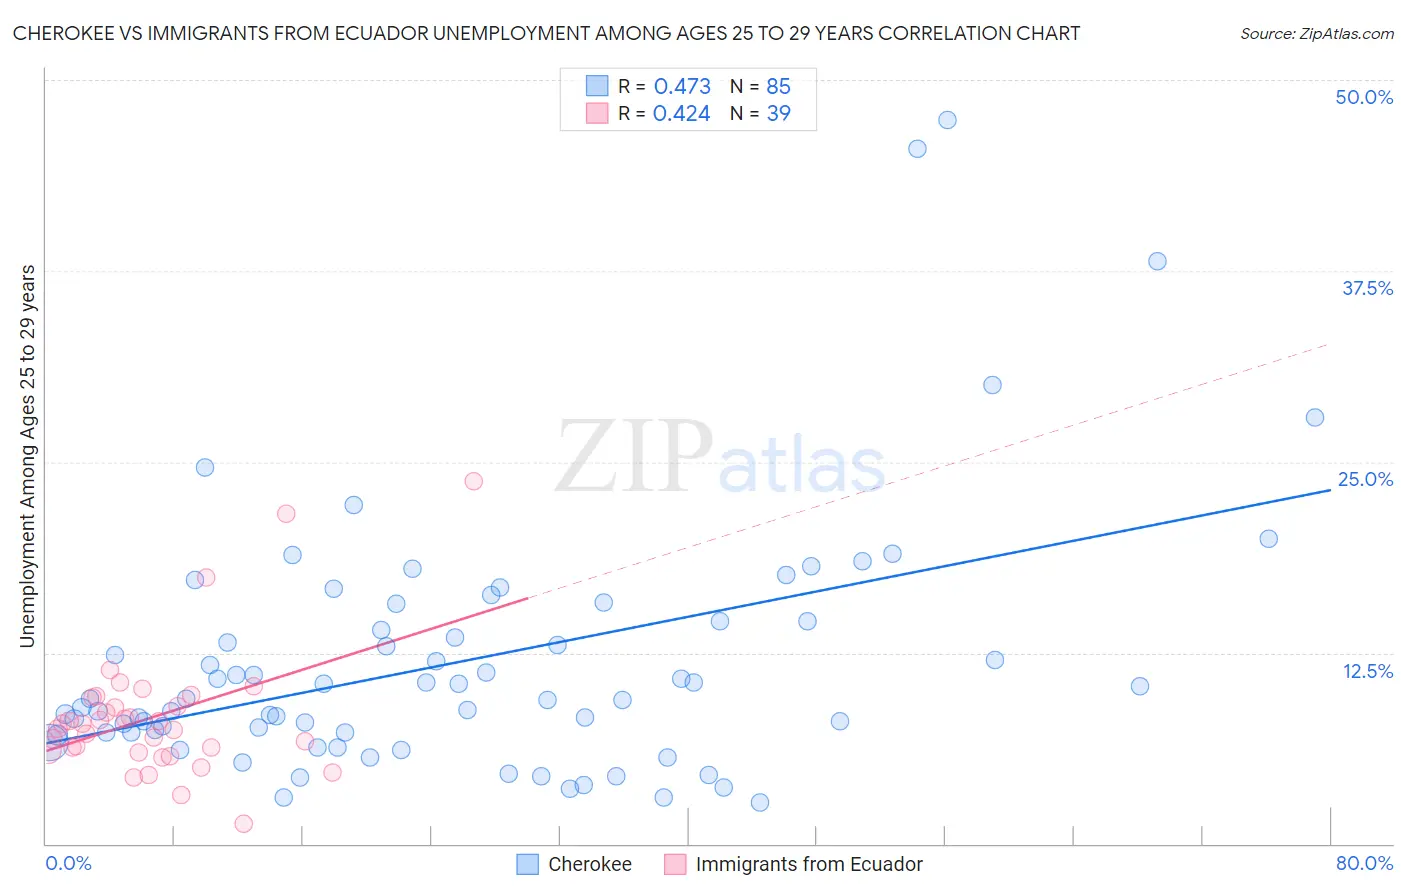
Cherokee vs Immigrants from Ecuador Unemployment Among Ages 25 to 29 years Correlation Chart
The statistical analysis conducted on geographies consisting of 454,121,490 people shows a moderate positive correlation between the proportion of Cherokee and unemployment rate among population between the ages 25 and 29 in the United States with a correlation coefficient (R) of 0.473 and weighted average of 7.6%. Similarly, the statistical analysis conducted on geographies consisting of 263,330,571 people shows a moderate positive correlation between the proportion of Immigrants from Ecuador and unemployment rate among population between the ages 25 and 29 in the United States with a correlation coefficient (R) of 0.424 and weighted average of 7.4%, a difference of 2.1%.
Unemployment Among Ages 25 to 29 years Correlation Summary
| Measurement | Cherokee | Immigrants from Ecuador |
| Minimum | 2.7% | 1.3% |
| Maximum | 47.4% | 23.7% |
| Range | 44.7% | 22.4% |
| Mean | 11.9% | 8.3% |
| Median | 9.5% | 7.9% |
| Interquartile 25% (IQ1) | 7.3% | 6.2% |
| Interquartile 75% (IQ3) | 14.6% | 9.6% |
| Interquartile Range (IQR) | 7.3% | 3.4% |
| Standard Deviation (Sample) | 8.3% | 4.3% |
| Standard Deviation (Population) | 8.2% | 4.2% |
Demographics Similar to Cherokee and Immigrants from Ecuador by Unemployment Among Ages 25 to 29 years
In terms of unemployment among ages 25 to 29 years, the demographic groups most similar to Cherokee are Creek (7.6%, a difference of 0.010%), Senegalese (7.6%, a difference of 0.12%), Immigrants from Senegal (7.6%, a difference of 0.18%), Vietnamese (7.6%, a difference of 0.21%), and Immigrants from Bangladesh (7.5%, a difference of 0.35%). Similarly, the demographic groups most similar to Immigrants from Ecuador are Pennsylvania German (7.4%, a difference of 0.020%), Immigrants from Latin America (7.4%, a difference of 0.060%), Paiute (7.4%, a difference of 0.090%), Bahamian (7.5%, a difference of 0.57%), and Choctaw (7.5%, a difference of 0.59%).
| Demographics | Rating | Rank | Unemployment Among Ages 25 to 29 years |
| Paiute | 0.1 /100 | #266 | Tragic 7.4% |
| Pennsylvania Germans | 0.1 /100 | #267 | Tragic 7.4% |
| Immigrants | Ecuador | 0.1 /100 | #268 | Tragic 7.4% |
| Immigrants | Latin America | 0.1 /100 | #269 | Tragic 7.4% |
| Bahamians | 0.0 /100 | #270 | Tragic 7.5% |
| Choctaw | 0.0 /100 | #271 | Tragic 7.5% |
| Immigrants | Bahamas | 0.0 /100 | #272 | Tragic 7.5% |
| Immigrants | Nigeria | 0.0 /100 | #273 | Tragic 7.5% |
| Immigrants | Central America | 0.0 /100 | #274 | Tragic 7.5% |
| Immigrants | Ghana | 0.0 /100 | #275 | Tragic 7.5% |
| French American Indians | 0.0 /100 | #276 | Tragic 7.5% |
| Iroquois | 0.0 /100 | #277 | Tragic 7.5% |
| Mexicans | 0.0 /100 | #278 | Tragic 7.5% |
| Nepalese | 0.0 /100 | #279 | Tragic 7.5% |
| Immigrants | Caribbean | 0.0 /100 | #280 | Tragic 7.5% |
| Immigrants | Bangladesh | 0.0 /100 | #281 | Tragic 7.5% |
| Immigrants | Senegal | 0.0 /100 | #282 | Tragic 7.6% |
| Creek | 0.0 /100 | #283 | Tragic 7.6% |
| Cherokee | 0.0 /100 | #284 | Tragic 7.6% |
| Senegalese | 0.0 /100 | #285 | Tragic 7.6% |
| Vietnamese | 0.0 /100 | #286 | Tragic 7.6% |