Nepalese vs Immigrants from Northern Europe In Labor Force | Age 20-24
COMPARE
Nepalese
Immigrants from Northern Europe
In Labor Force | Age 20-24
In Labor Force | Age 20-24 Comparison
Nepalese
Immigrants from Northern Europe
74.5%
IN LABOR FORCE | AGE 20-24
10.5/ 100
METRIC RATING
219th/ 347
METRIC RANK
74.8%
IN LABOR FORCE | AGE 20-24
32.6/ 100
METRIC RATING
189th/ 347
METRIC RANK
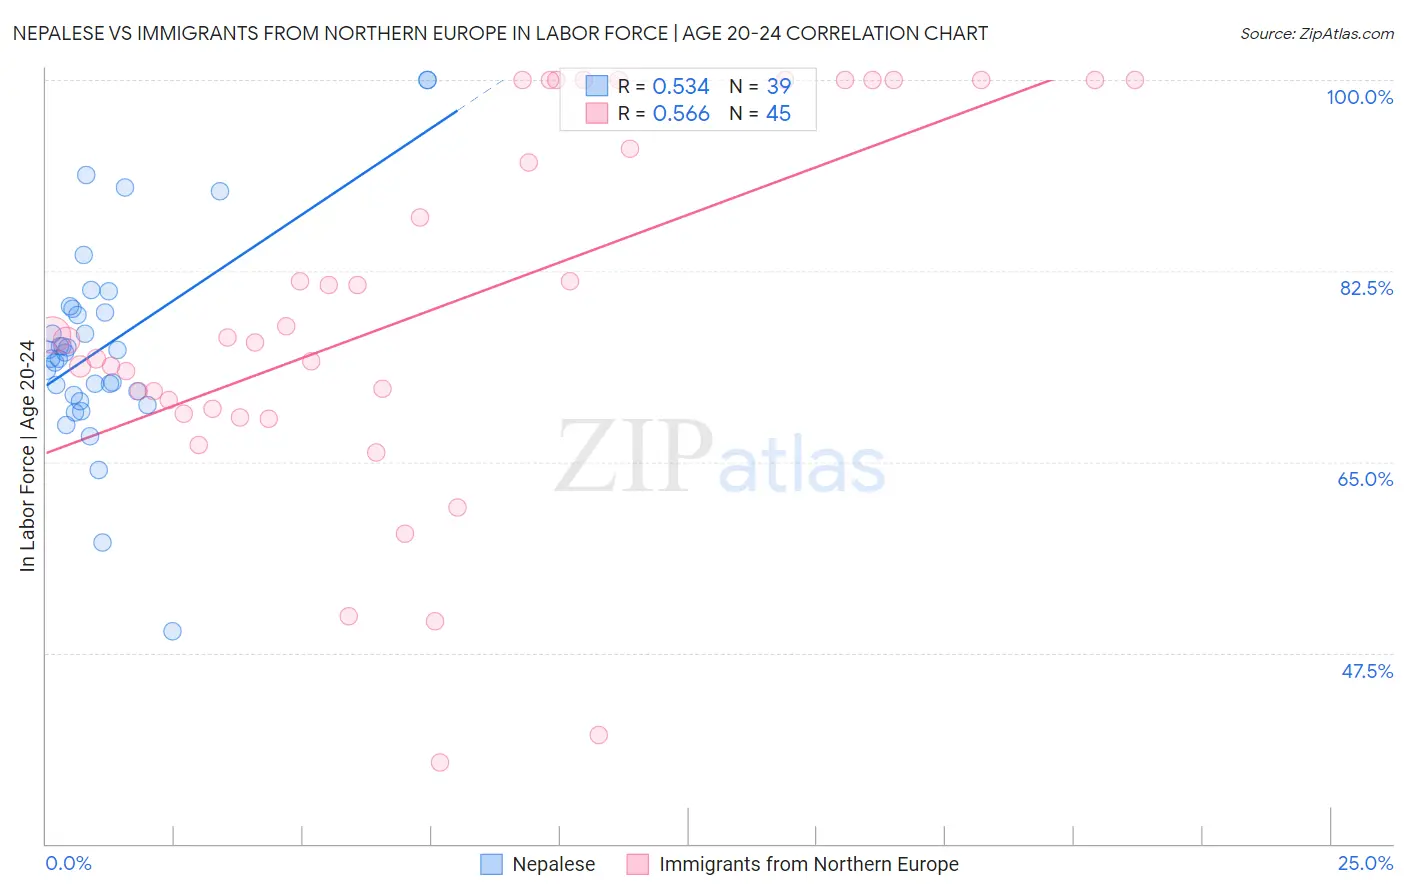
Nepalese vs Immigrants from Northern Europe In Labor Force | Age 20-24 Correlation Chart
The statistical analysis conducted on geographies consisting of 24,516,862 people shows a substantial positive correlation between the proportion of Nepalese and labor force participation rate among population between the ages 20 and 24 in the United States with a correlation coefficient (R) of 0.534 and weighted average of 74.5%. Similarly, the statistical analysis conducted on geographies consisting of 476,778,788 people shows a substantial positive correlation between the proportion of Immigrants from Northern Europe and labor force participation rate among population between the ages 20 and 24 in the United States with a correlation coefficient (R) of 0.566 and weighted average of 74.8%, a difference of 0.52%.
In Labor Force | Age 20-24 Correlation Summary
| Measurement | Nepalese | Immigrants from Northern Europe |
| Minimum | 49.5% | 37.5% |
| Maximum | 100.0% | 100.0% |
| Range | 50.5% | 62.5% |
| Mean | 75.7% | 78.8% |
| Median | 75.1% | 76.1% |
| Interquartile 25% (IQ1) | 71.2% | 69.6% |
| Interquartile 75% (IQ3) | 79.0% | 100.0% |
| Interquartile Range (IQR) | 7.9% | 30.4% |
| Standard Deviation (Sample) | 9.6% | 16.9% |
| Standard Deviation (Population) | 9.5% | 16.7% |
Similar Demographics by In Labor Force | Age 20-24
Demographics Similar to Nepalese by In Labor Force | Age 20-24
In terms of in labor force | age 20-24, the demographic groups most similar to Nepalese are Immigrants from Peru (74.5%, a difference of 0.0%), Immigrants from Norway (74.5%, a difference of 0.010%), Chickasaw (74.5%, a difference of 0.010%), Immigrants from India (74.4%, a difference of 0.030%), and Chilean (74.5%, a difference of 0.070%).
| Demographics | Rating | Rank | In Labor Force | Age 20-24 |
| Creek | 13.3 /100 | #212 | Poor 74.5% |
| Peruvians | 13.3 /100 | #213 | Poor 74.5% |
| Immigrants | Southern Europe | 13.2 /100 | #214 | Poor 74.5% |
| Immigrants | Ghana | 12.7 /100 | #215 | Poor 74.5% |
| Immigrants | Kuwait | 12.7 /100 | #216 | Poor 74.5% |
| Chileans | 12.5 /100 | #217 | Poor 74.5% |
| Immigrants | Peru | 10.6 /100 | #218 | Poor 74.5% |
| Nepalese | 10.5 /100 | #219 | Poor 74.5% |
| Immigrants | Norway | 10.3 /100 | #220 | Poor 74.5% |
| Chickasaw | 10.3 /100 | #221 | Poor 74.5% |
| Immigrants | India | 9.9 /100 | #222 | Tragic 74.4% |
| Hispanics or Latinos | 7.9 /100 | #223 | Tragic 74.4% |
| Seminole | 6.9 /100 | #224 | Tragic 74.3% |
| Ghanaians | 6.2 /100 | #225 | Tragic 74.3% |
| Immigrants | Fiji | 5.9 /100 | #226 | Tragic 74.3% |
Demographics Similar to Immigrants from Northern Europe by In Labor Force | Age 20-24
In terms of in labor force | age 20-24, the demographic groups most similar to Immigrants from Northern Europe are Honduran (74.8%, a difference of 0.0%), Immigrants from Honduras (74.9%, a difference of 0.010%), Russian (74.8%, a difference of 0.010%), Immigrants from Eastern Europe (74.9%, a difference of 0.020%), and Immigrants from Hungary (74.9%, a difference of 0.040%).
| Demographics | Rating | Rank | In Labor Force | Age 20-24 |
| Immigrants | South Africa | 36.9 /100 | #182 | Fair 74.9% |
| Immigrants | Costa Rica | 36.7 /100 | #183 | Fair 74.9% |
| Immigrants | Hungary | 35.0 /100 | #184 | Fair 74.9% |
| Sri Lankans | 34.9 /100 | #185 | Fair 74.9% |
| Immigrants | Eastern Europe | 33.8 /100 | #186 | Fair 74.9% |
| Immigrants | Honduras | 33.5 /100 | #187 | Fair 74.9% |
| Hondurans | 32.7 /100 | #188 | Fair 74.8% |
| Immigrants | Northern Europe | 32.6 /100 | #189 | Fair 74.8% |
| Russians | 32.2 /100 | #190 | Fair 74.8% |
| Senegalese | 28.1 /100 | #191 | Fair 74.8% |
| Immigrants | Europe | 27.5 /100 | #192 | Fair 74.8% |
| Alsatians | 27.1 /100 | #193 | Fair 74.8% |
| Immigrants | Denmark | 25.8 /100 | #194 | Fair 74.8% |
| Eastern Europeans | 25.4 /100 | #195 | Fair 74.8% |
| Immigrants | Vietnam | 25.1 /100 | #196 | Fair 74.7% |