Ottawa vs Immigrants from Barbados In Labor Force | Age 20-24
COMPARE
Ottawa
Immigrants from Barbados
In Labor Force | Age 20-24
In Labor Force | Age 20-24 Comparison
Ottawa
Immigrants from Barbados
76.8%
IN LABOR FORCE | AGE 20-24
99.8/ 100
METRIC RATING
70th/ 347
METRIC RANK
69.7%
IN LABOR FORCE | AGE 20-24
0.0/ 100
METRIC RATING
335th/ 347
METRIC RANK
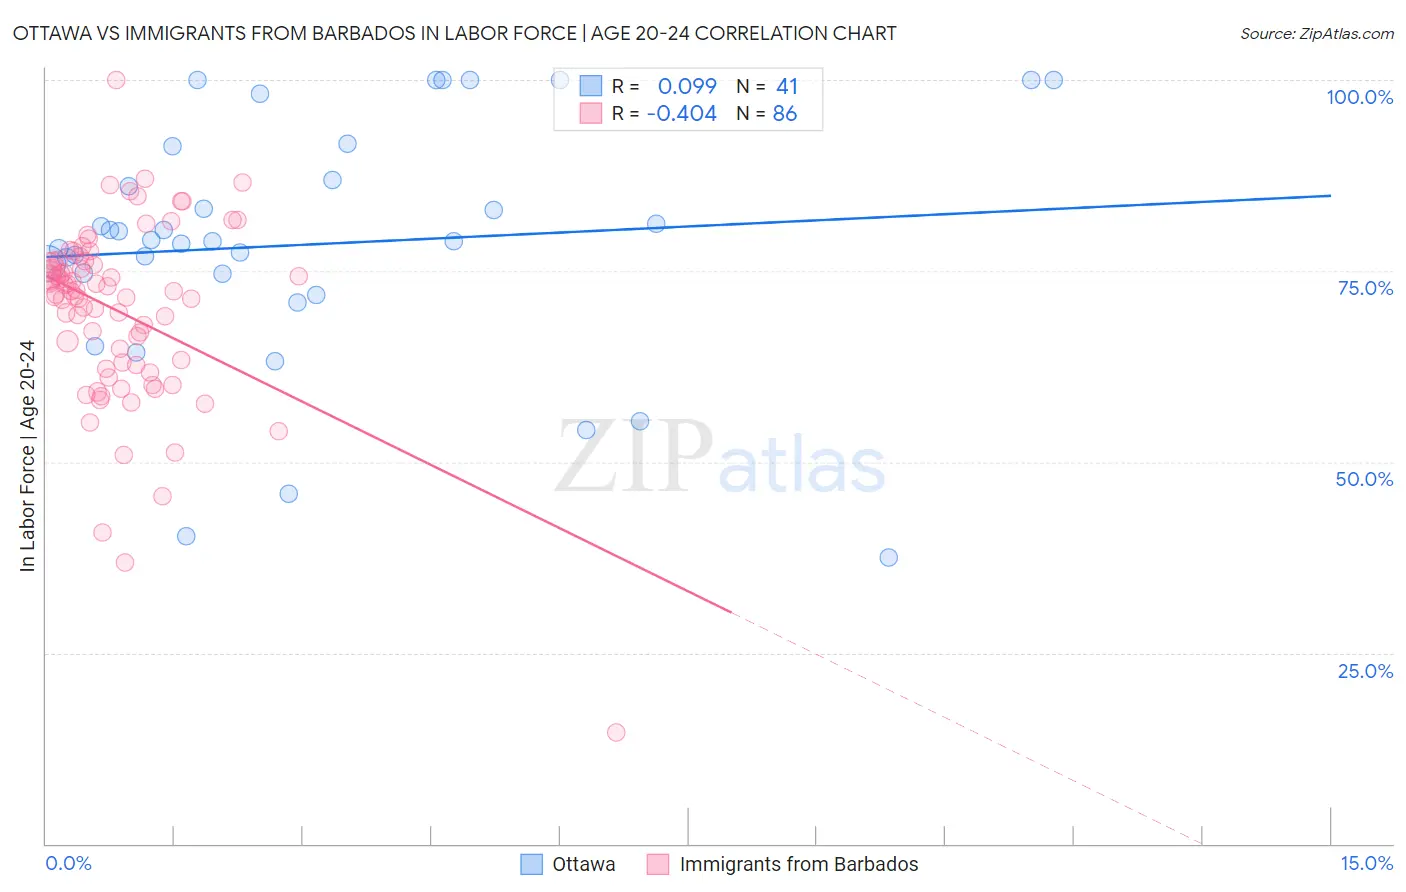
Ottawa vs Immigrants from Barbados In Labor Force | Age 20-24 Correlation Chart
The statistical analysis conducted on geographies consisting of 49,950,403 people shows a slight positive correlation between the proportion of Ottawa and labor force participation rate among population between the ages 20 and 24 in the United States with a correlation coefficient (R) of 0.099 and weighted average of 76.8%. Similarly, the statistical analysis conducted on geographies consisting of 112,783,156 people shows a moderate negative correlation between the proportion of Immigrants from Barbados and labor force participation rate among population between the ages 20 and 24 in the United States with a correlation coefficient (R) of -0.404 and weighted average of 69.7%, a difference of 10.2%.
In Labor Force | Age 20-24 Correlation Summary
| Measurement | Ottawa | Immigrants from Barbados |
| Minimum | 37.5% | 14.5% |
| Maximum | 100.0% | 100.0% |
| Range | 62.5% | 85.5% |
| Mean | 78.5% | 69.6% |
| Median | 78.9% | 72.1% |
| Interquartile 25% (IQ1) | 73.2% | 62.6% |
| Interquartile 75% (IQ3) | 89.1% | 76.2% |
| Interquartile Range (IQR) | 15.9% | 13.6% |
| Standard Deviation (Sample) | 16.0% | 12.2% |
| Standard Deviation (Population) | 15.8% | 12.1% |
Similar Demographics by In Labor Force | Age 20-24
Demographics Similar to Ottawa by In Labor Force | Age 20-24
In terms of in labor force | age 20-24, the demographic groups most similar to Ottawa are Immigrants from Sudan (76.8%, a difference of 0.010%), French American Indian (76.8%, a difference of 0.030%), Slavic (76.9%, a difference of 0.060%), Icelander (76.9%, a difference of 0.070%), and Northern European (76.8%, a difference of 0.070%).
| Demographics | Rating | Rank | In Labor Force | Age 20-24 |
| Lithuanians | 99.9 /100 | #63 | Exceptional 77.0% |
| Whites/Caucasians | 99.9 /100 | #64 | Exceptional 76.9% |
| Crow | 99.9 /100 | #65 | Exceptional 76.9% |
| Icelanders | 99.9 /100 | #66 | Exceptional 76.9% |
| Slavs | 99.9 /100 | #67 | Exceptional 76.9% |
| French American Indians | 99.8 /100 | #68 | Exceptional 76.8% |
| Immigrants | Sudan | 99.8 /100 | #69 | Exceptional 76.8% |
| Ottawa | 99.8 /100 | #70 | Exceptional 76.8% |
| Northern Europeans | 99.8 /100 | #71 | Exceptional 76.8% |
| Guamanians/Chamorros | 99.8 /100 | #72 | Exceptional 76.7% |
| British | 99.8 /100 | #73 | Exceptional 76.7% |
| Cree | 99.7 /100 | #74 | Exceptional 76.6% |
| Immigrants | Middle Africa | 99.7 /100 | #75 | Exceptional 76.6% |
| Immigrants | Moldova | 99.6 /100 | #76 | Exceptional 76.6% |
| Immigrants | Cameroon | 99.6 /100 | #77 | Exceptional 76.6% |
Demographics Similar to Immigrants from Barbados by In Labor Force | Age 20-24
In terms of in labor force | age 20-24, the demographic groups most similar to Immigrants from Barbados are British West Indian (70.0%, a difference of 0.35%), Immigrants from Guyana (69.3%, a difference of 0.66%), Yuman (70.3%, a difference of 0.75%), Guyanese (69.2%, a difference of 0.79%), and Immigrants from Uzbekistan (70.4%, a difference of 0.98%).
| Demographics | Rating | Rank | In Labor Force | Age 20-24 |
| Immigrants | China | 0.0 /100 | #328 | Tragic 71.1% |
| Yup'ik | 0.0 /100 | #329 | Tragic 70.9% |
| Vietnamese | 0.0 /100 | #330 | Tragic 70.6% |
| Immigrants | Bangladesh | 0.0 /100 | #331 | Tragic 70.6% |
| Immigrants | Uzbekistan | 0.0 /100 | #332 | Tragic 70.4% |
| Yuman | 0.0 /100 | #333 | Tragic 70.3% |
| British West Indians | 0.0 /100 | #334 | Tragic 70.0% |
| Immigrants | Barbados | 0.0 /100 | #335 | Tragic 69.7% |
| Immigrants | Guyana | 0.0 /100 | #336 | Tragic 69.3% |
| Guyanese | 0.0 /100 | #337 | Tragic 69.2% |
| Pima | 0.0 /100 | #338 | Tragic 69.0% |
| Immigrants | Yemen | 0.0 /100 | #339 | Tragic 68.9% |
| Menominee | 0.0 /100 | #340 | Tragic 68.7% |
| Tohono O'odham | 0.0 /100 | #341 | Tragic 68.6% |
| Immigrants | St. Vincent and the Grenadines | 0.0 /100 | #342 | Tragic 68.4% |