Celtic vs Immigrants from Barbados Unemployment Among Seniors over 65 years
COMPARE
Celtic
Immigrants from Barbados
Unemployment Among Seniors over 65 years
Unemployment Among Seniors over 65 years Comparison
Celtics
Immigrants from Barbados
5.0%
UNEMPLOYMENT AMONG SENIORS OVER 65 YEARS
91.3/ 100
METRIC RATING
115th/ 347
METRIC RANK
5.5%
UNEMPLOYMENT AMONG SENIORS OVER 65 YEARS
0.0/ 100
METRIC RATING
286th/ 347
METRIC RANK
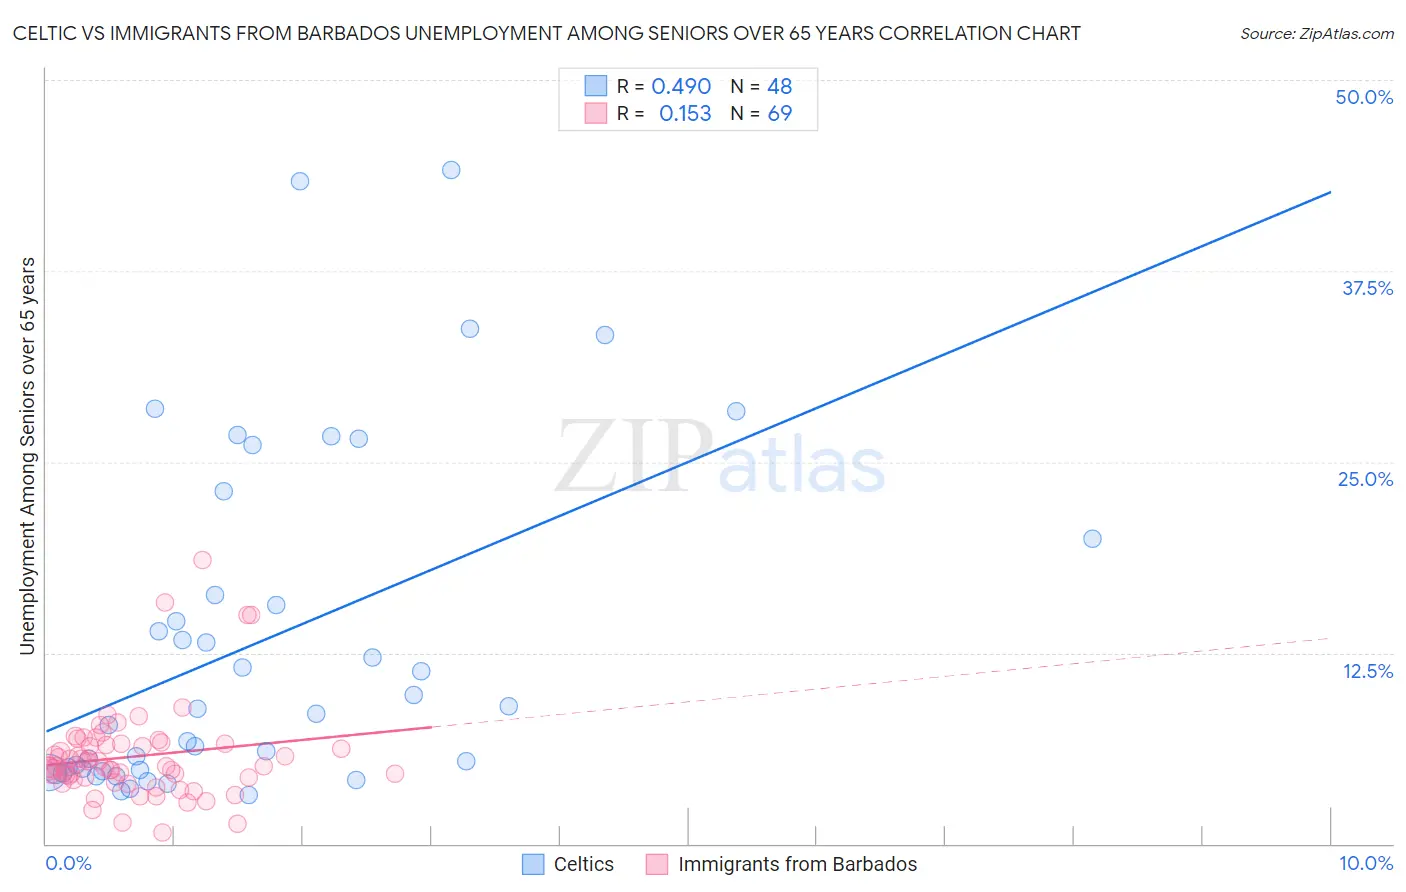
Celtic vs Immigrants from Barbados Unemployment Among Seniors over 65 years Correlation Chart
The statistical analysis conducted on geographies consisting of 157,481,769 people shows a moderate positive correlation between the proportion of Celtics and unemployment rate amomg seniors over the age of 65 in the United States with a correlation coefficient (R) of 0.490 and weighted average of 5.0%. Similarly, the statistical analysis conducted on geographies consisting of 109,022,444 people shows a poor positive correlation between the proportion of Immigrants from Barbados and unemployment rate amomg seniors over the age of 65 in the United States with a correlation coefficient (R) of 0.153 and weighted average of 5.5%, a difference of 8.9%.
Unemployment Among Seniors over 65 years Correlation Summary
| Measurement | Celtic | Immigrants from Barbados |
| Minimum | 3.2% | 0.70% |
| Maximum | 44.1% | 18.6% |
| Range | 40.9% | 17.9% |
| Mean | 13.2% | 5.7% |
| Median | 8.7% | 5.1% |
| Interquartile 25% (IQ1) | 4.8% | 4.2% |
| Interquartile 75% (IQ3) | 18.1% | 6.6% |
| Interquartile Range (IQR) | 13.4% | 2.3% |
| Standard Deviation (Sample) | 11.0% | 3.1% |
| Standard Deviation (Population) | 10.9% | 3.1% |
Similar Demographics by Unemployment Among Seniors over 65 years
Demographics Similar to Celtics by Unemployment Among Seniors over 65 years
In terms of unemployment among seniors over 65 years, the demographic groups most similar to Celtics are Seminole (5.0%, a difference of 0.010%), Immigrants from Latvia (5.0%, a difference of 0.010%), Immigrants from Korea (5.0%, a difference of 0.030%), Eastern European (5.0%, a difference of 0.070%), and Malaysian (5.1%, a difference of 0.090%).
| Demographics | Rating | Rank | Unemployment Among Seniors over 65 years |
| Immigrants | Vietnam | 92.9 /100 | #108 | Exceptional 5.0% |
| Immigrants | Malaysia | 92.7 /100 | #109 | Exceptional 5.0% |
| Immigrants | Saudi Arabia | 92.7 /100 | #110 | Exceptional 5.0% |
| Finns | 92.2 /100 | #111 | Exceptional 5.0% |
| Eastern Europeans | 92.0 /100 | #112 | Exceptional 5.0% |
| Seminole | 91.4 /100 | #113 | Exceptional 5.0% |
| Immigrants | Latvia | 91.4 /100 | #114 | Exceptional 5.0% |
| Celtics | 91.3 /100 | #115 | Exceptional 5.0% |
| Immigrants | Korea | 91.0 /100 | #116 | Exceptional 5.0% |
| Malaysians | 90.4 /100 | #117 | Exceptional 5.1% |
| Soviet Union | 90.1 /100 | #118 | Exceptional 5.1% |
| Immigrants | Canada | 89.7 /100 | #119 | Excellent 5.1% |
| Irish | 88.8 /100 | #120 | Excellent 5.1% |
| Puget Sound Salish | 88.7 /100 | #121 | Excellent 5.1% |
| Immigrants | Cameroon | 88.6 /100 | #122 | Excellent 5.1% |
Demographics Similar to Immigrants from Barbados by Unemployment Among Seniors over 65 years
In terms of unemployment among seniors over 65 years, the demographic groups most similar to Immigrants from Barbados are Central American (5.5%, a difference of 0.030%), Venezuelan (5.5%, a difference of 0.030%), U.S. Virgin Islander (5.5%, a difference of 0.030%), Immigrants from Cabo Verde (5.5%, a difference of 0.060%), and Immigrants from Liberia (5.5%, a difference of 0.080%).
| Demographics | Rating | Rank | Unemployment Among Seniors over 65 years |
| Brazilians | 0.1 /100 | #279 | Tragic 5.5% |
| Immigrants | South America | 0.1 /100 | #280 | Tragic 5.5% |
| Immigrants | Norway | 0.0 /100 | #281 | Tragic 5.5% |
| Immigrants | Belize | 0.0 /100 | #282 | Tragic 5.5% |
| Immigrants | Haiti | 0.0 /100 | #283 | Tragic 5.5% |
| Immigrants | Liberia | 0.0 /100 | #284 | Tragic 5.5% |
| Central Americans | 0.0 /100 | #285 | Tragic 5.5% |
| Immigrants | Barbados | 0.0 /100 | #286 | Tragic 5.5% |
| Venezuelans | 0.0 /100 | #287 | Tragic 5.5% |
| U.S. Virgin Islanders | 0.0 /100 | #288 | Tragic 5.5% |
| Immigrants | Cabo Verde | 0.0 /100 | #289 | Tragic 5.5% |
| Jamaicans | 0.0 /100 | #290 | Tragic 5.5% |
| Blacks/African Americans | 0.0 /100 | #291 | Tragic 5.5% |
| Belizeans | 0.0 /100 | #292 | Tragic 5.5% |
| Immigrants | Venezuela | 0.0 /100 | #293 | Tragic 5.5% |