Immigrants from Netherlands vs Immigrants from Austria In Labor Force | Age 20-24
COMPARE
Immigrants from Netherlands
Immigrants from Austria
In Labor Force | Age 20-24
In Labor Force | Age 20-24 Comparison
Immigrants from Netherlands
Immigrants from Austria
75.9%
IN LABOR FORCE | AGE 20-24
95.3/ 100
METRIC RATING
113th/ 347
METRIC RANK
75.6%
IN LABOR FORCE | AGE 20-24
88.8/ 100
METRIC RATING
130th/ 347
METRIC RANK
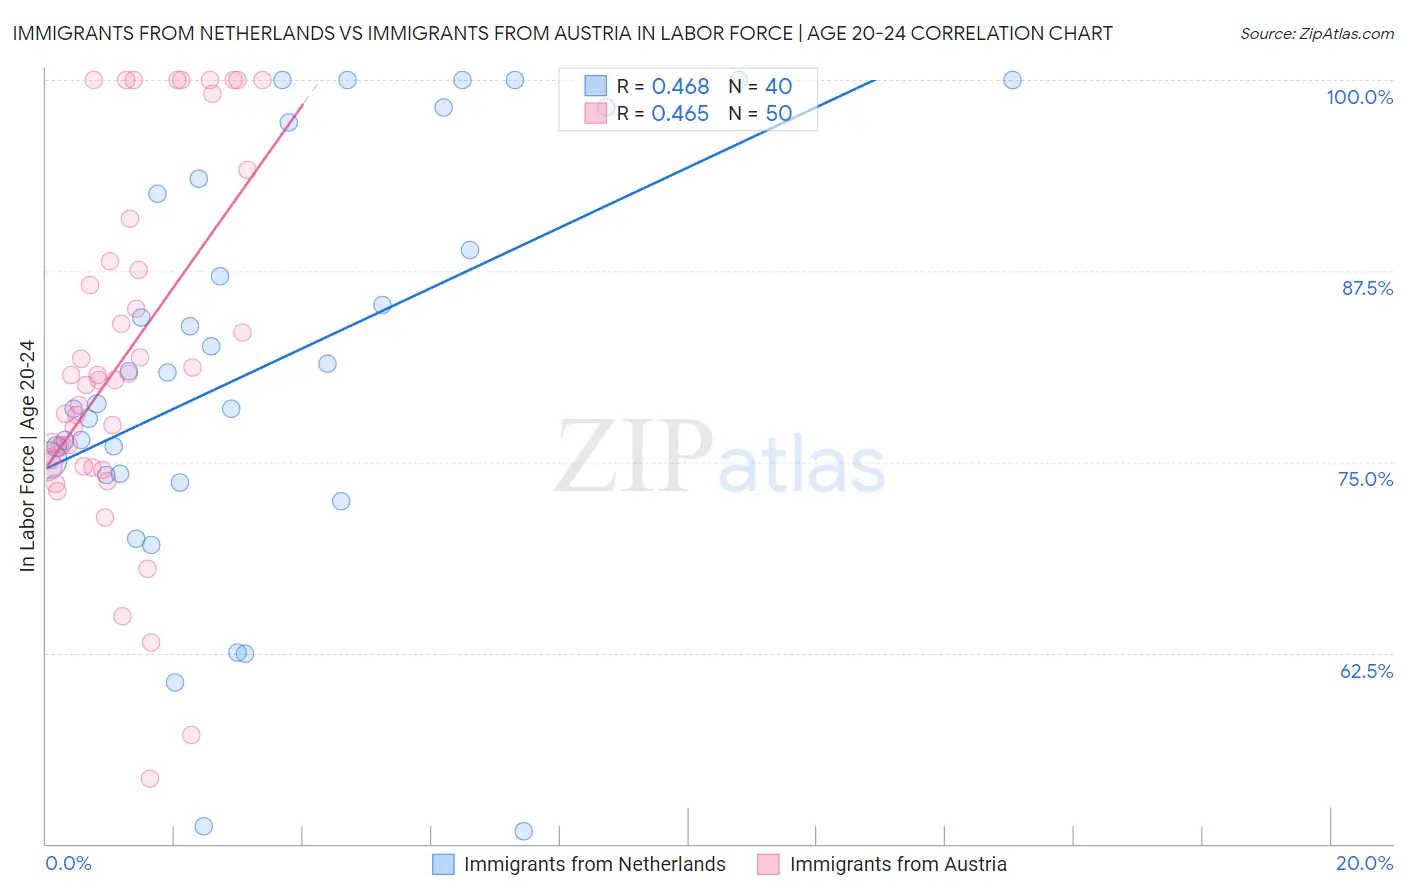
Immigrants from Netherlands vs Immigrants from Austria In Labor Force | Age 20-24 Correlation Chart
The statistical analysis conducted on geographies consisting of 237,756,787 people shows a moderate positive correlation between the proportion of Immigrants from Netherlands and labor force participation rate among population between the ages 20 and 24 in the United States with a correlation coefficient (R) of 0.468 and weighted average of 75.9%. Similarly, the statistical analysis conducted on geographies consisting of 167,871,666 people shows a moderate positive correlation between the proportion of Immigrants from Austria and labor force participation rate among population between the ages 20 and 24 in the United States with a correlation coefficient (R) of 0.465 and weighted average of 75.6%, a difference of 0.34%.
In Labor Force | Age 20-24 Correlation Summary
| Measurement | Immigrants from Netherlands | Immigrants from Austria |
| Minimum | 50.8% | 54.3% |
| Maximum | 100.0% | 100.0% |
| Range | 49.2% | 45.7% |
| Mean | 81.3% | 81.9% |
| Median | 79.8% | 80.3% |
| Interquartile 25% (IQ1) | 74.2% | 74.7% |
| Interquartile 75% (IQ3) | 93.0% | 88.1% |
| Interquartile Range (IQR) | 18.9% | 13.4% |
| Standard Deviation (Sample) | 13.4% | 11.6% |
| Standard Deviation (Population) | 13.2% | 11.5% |
Demographics Similar to Immigrants from Netherlands and Immigrants from Austria by In Labor Force | Age 20-24
In terms of in labor force | age 20-24, the demographic groups most similar to Immigrants from Netherlands are Immigrants from Zimbabwe (75.9%, a difference of 0.010%), Alaska Native (75.9%, a difference of 0.010%), Immigrants from North America (75.9%, a difference of 0.020%), Immigrants from Canada (75.9%, a difference of 0.030%), and Assyrian/Chaldean/Syriac (75.9%, a difference of 0.030%). Similarly, the demographic groups most similar to Immigrants from Austria are Iroquois (75.6%, a difference of 0.010%), Immigrants from Jordan (75.6%, a difference of 0.010%), Immigrants from Afghanistan (75.6%, a difference of 0.020%), Subsaharan African (75.7%, a difference of 0.080%), and Brazilian (75.8%, a difference of 0.19%).
| Demographics | Rating | Rank | In Labor Force | Age 20-24 |
| Ukrainians | 95.7 /100 | #111 | Exceptional 75.9% |
| Immigrants | Canada | 95.6 /100 | #112 | Exceptional 75.9% |
| Immigrants | Netherlands | 95.3 /100 | #113 | Exceptional 75.9% |
| Immigrants | Zimbabwe | 95.1 /100 | #114 | Exceptional 75.9% |
| Alaska Natives | 95.1 /100 | #115 | Exceptional 75.9% |
| Immigrants | North America | 95.0 /100 | #116 | Exceptional 75.9% |
| Assyrians/Chaldeans/Syriacs | 94.9 /100 | #117 | Exceptional 75.9% |
| Spanish Americans | 94.8 /100 | #118 | Exceptional 75.8% |
| Immigrants | Portugal | 94.8 /100 | #119 | Exceptional 75.8% |
| Immigrants | Africa | 94.6 /100 | #120 | Exceptional 75.8% |
| Immigrants | Serbia | 94.3 /100 | #121 | Exceptional 75.8% |
| Pakistanis | 94.1 /100 | #122 | Exceptional 75.8% |
| Immigrants | Bulgaria | 94.1 /100 | #123 | Exceptional 75.8% |
| Immigrants | Sierra Leone | 93.8 /100 | #124 | Exceptional 75.8% |
| Immigrants | Scotland | 93.7 /100 | #125 | Exceptional 75.8% |
| Brazilians | 93.0 /100 | #126 | Exceptional 75.8% |
| Sub-Saharan Africans | 90.9 /100 | #127 | Exceptional 75.7% |
| Immigrants | Afghanistan | 89.4 /100 | #128 | Excellent 75.6% |
| Iroquois | 89.1 /100 | #129 | Excellent 75.6% |
| Immigrants | Austria | 88.8 /100 | #130 | Excellent 75.6% |
| Immigrants | Jordan | 88.5 /100 | #131 | Excellent 75.6% |