French American Indian vs Immigrants from Austria In Labor Force | Age 20-24
COMPARE
French American Indian
Immigrants from Austria
In Labor Force | Age 20-24
In Labor Force | Age 20-24 Comparison
French American Indians
Immigrants from Austria
76.8%
IN LABOR FORCE | AGE 20-24
99.8/ 100
METRIC RATING
68th/ 347
METRIC RANK
75.6%
IN LABOR FORCE | AGE 20-24
88.8/ 100
METRIC RATING
130th/ 347
METRIC RANK
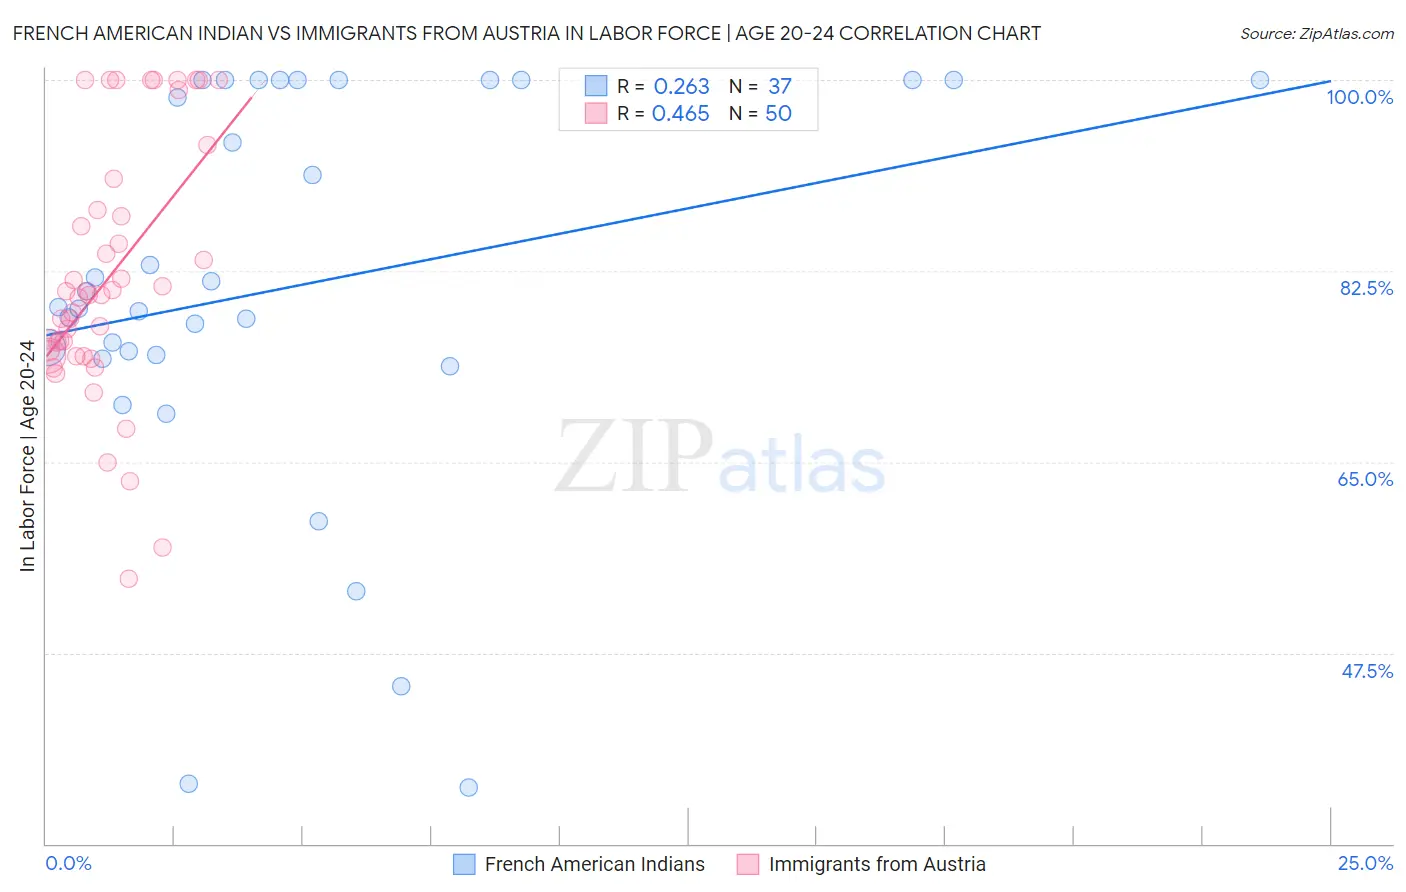
French American Indian vs Immigrants from Austria In Labor Force | Age 20-24 Correlation Chart
The statistical analysis conducted on geographies consisting of 131,958,584 people shows a weak positive correlation between the proportion of French American Indians and labor force participation rate among population between the ages 20 and 24 in the United States with a correlation coefficient (R) of 0.263 and weighted average of 76.8%. Similarly, the statistical analysis conducted on geographies consisting of 167,871,666 people shows a moderate positive correlation between the proportion of Immigrants from Austria and labor force participation rate among population between the ages 20 and 24 in the United States with a correlation coefficient (R) of 0.465 and weighted average of 75.6%, a difference of 1.6%.
In Labor Force | Age 20-24 Correlation Summary
| Measurement | French American Indian | Immigrants from Austria |
| Minimum | 35.1% | 54.3% |
| Maximum | 100.0% | 100.0% |
| Range | 64.9% | 45.7% |
| Mean | 81.1% | 81.9% |
| Median | 79.2% | 80.3% |
| Interquartile 25% (IQ1) | 74.6% | 74.7% |
| Interquartile 75% (IQ3) | 100.0% | 88.1% |
| Interquartile Range (IQR) | 25.4% | 13.4% |
| Standard Deviation (Sample) | 18.1% | 11.6% |
| Standard Deviation (Population) | 17.9% | 11.5% |
Similar Demographics by In Labor Force | Age 20-24
Demographics Similar to French American Indians by In Labor Force | Age 20-24
In terms of in labor force | age 20-24, the demographic groups most similar to French American Indians are Immigrants from Sudan (76.8%, a difference of 0.020%), Ottawa (76.8%, a difference of 0.030%), Icelander (76.9%, a difference of 0.040%), Slavic (76.9%, a difference of 0.040%), and Crow (76.9%, a difference of 0.060%).
| Demographics | Rating | Rank | In Labor Force | Age 20-24 |
| Immigrants | Eritrea | 99.9 /100 | #61 | Exceptional 77.0% |
| Immigrants | Kenya | 99.9 /100 | #62 | Exceptional 77.0% |
| Lithuanians | 99.9 /100 | #63 | Exceptional 77.0% |
| Whites/Caucasians | 99.9 /100 | #64 | Exceptional 76.9% |
| Crow | 99.9 /100 | #65 | Exceptional 76.9% |
| Icelanders | 99.9 /100 | #66 | Exceptional 76.9% |
| Slavs | 99.9 /100 | #67 | Exceptional 76.9% |
| French American Indians | 99.8 /100 | #68 | Exceptional 76.8% |
| Immigrants | Sudan | 99.8 /100 | #69 | Exceptional 76.8% |
| Ottawa | 99.8 /100 | #70 | Exceptional 76.8% |
| Northern Europeans | 99.8 /100 | #71 | Exceptional 76.8% |
| Guamanians/Chamorros | 99.8 /100 | #72 | Exceptional 76.7% |
| British | 99.8 /100 | #73 | Exceptional 76.7% |
| Cree | 99.7 /100 | #74 | Exceptional 76.6% |
| Immigrants | Middle Africa | 99.7 /100 | #75 | Exceptional 76.6% |
Demographics Similar to Immigrants from Austria by In Labor Force | Age 20-24
In terms of in labor force | age 20-24, the demographic groups most similar to Immigrants from Austria are Iroquois (75.6%, a difference of 0.010%), Immigrants from Jordan (75.6%, a difference of 0.010%), Palestinian (75.6%, a difference of 0.010%), Immigrants from Afghanistan (75.6%, a difference of 0.020%), and Zimbabwean (75.6%, a difference of 0.020%).
| Demographics | Rating | Rank | In Labor Force | Age 20-24 |
| Immigrants | Bulgaria | 94.1 /100 | #123 | Exceptional 75.8% |
| Immigrants | Sierra Leone | 93.8 /100 | #124 | Exceptional 75.8% |
| Immigrants | Scotland | 93.7 /100 | #125 | Exceptional 75.8% |
| Brazilians | 93.0 /100 | #126 | Exceptional 75.8% |
| Sub-Saharan Africans | 90.9 /100 | #127 | Exceptional 75.7% |
| Immigrants | Afghanistan | 89.4 /100 | #128 | Excellent 75.6% |
| Iroquois | 89.1 /100 | #129 | Excellent 75.6% |
| Immigrants | Austria | 88.8 /100 | #130 | Excellent 75.6% |
| Immigrants | Jordan | 88.5 /100 | #131 | Excellent 75.6% |
| Palestinians | 88.4 /100 | #132 | Excellent 75.6% |
| Zimbabweans | 88.2 /100 | #133 | Excellent 75.6% |
| Estonians | 87.1 /100 | #134 | Excellent 75.6% |
| Yaqui | 85.5 /100 | #135 | Excellent 75.5% |
| Immigrants | Brazil | 84.8 /100 | #136 | Excellent 75.5% |
| Jordanians | 84.8 /100 | #137 | Excellent 75.5% |