Immigrants from Northern Europe vs Immigrants from Austria In Labor Force | Age 20-24
COMPARE
Immigrants from Northern Europe
Immigrants from Austria
In Labor Force | Age 20-24
In Labor Force | Age 20-24 Comparison
Immigrants from Northern Europe
Immigrants from Austria
74.8%
IN LABOR FORCE | AGE 20-24
32.6/ 100
METRIC RATING
189th/ 347
METRIC RANK
75.6%
IN LABOR FORCE | AGE 20-24
88.8/ 100
METRIC RATING
130th/ 347
METRIC RANK
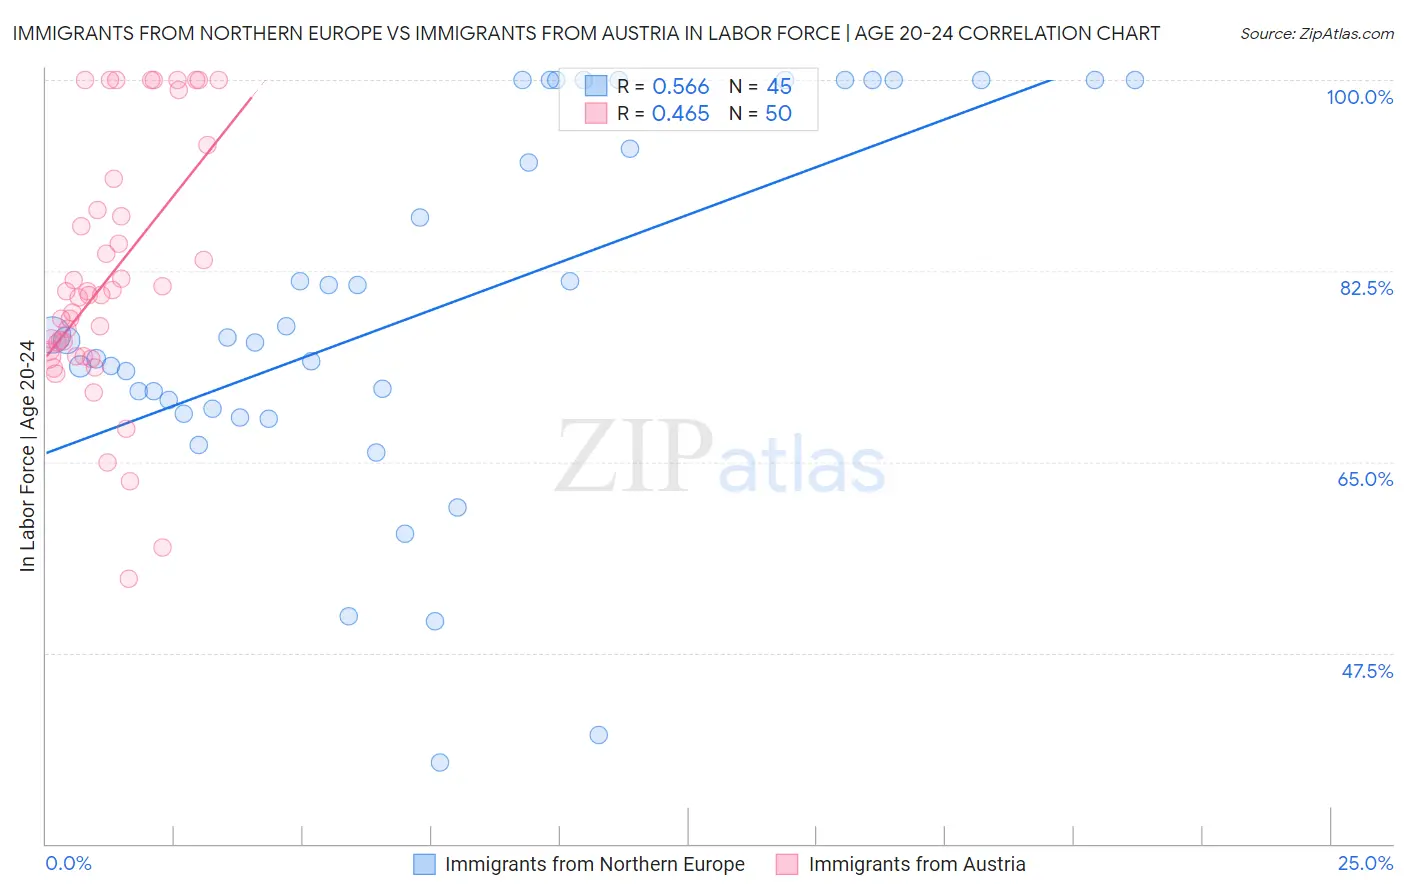
Immigrants from Northern Europe vs Immigrants from Austria In Labor Force | Age 20-24 Correlation Chart
The statistical analysis conducted on geographies consisting of 476,778,788 people shows a substantial positive correlation between the proportion of Immigrants from Northern Europe and labor force participation rate among population between the ages 20 and 24 in the United States with a correlation coefficient (R) of 0.566 and weighted average of 74.8%. Similarly, the statistical analysis conducted on geographies consisting of 167,871,666 people shows a moderate positive correlation between the proportion of Immigrants from Austria and labor force participation rate among population between the ages 20 and 24 in the United States with a correlation coefficient (R) of 0.465 and weighted average of 75.6%, a difference of 1.0%.
In Labor Force | Age 20-24 Correlation Summary
| Measurement | Immigrants from Northern Europe | Immigrants from Austria |
| Minimum | 37.5% | 54.3% |
| Maximum | 100.0% | 100.0% |
| Range | 62.5% | 45.7% |
| Mean | 78.8% | 81.9% |
| Median | 76.1% | 80.3% |
| Interquartile 25% (IQ1) | 69.6% | 74.7% |
| Interquartile 75% (IQ3) | 100.0% | 88.1% |
| Interquartile Range (IQR) | 30.4% | 13.4% |
| Standard Deviation (Sample) | 16.9% | 11.6% |
| Standard Deviation (Population) | 16.7% | 11.5% |
Similar Demographics by In Labor Force | Age 20-24
Demographics Similar to Immigrants from Northern Europe by In Labor Force | Age 20-24
In terms of in labor force | age 20-24, the demographic groups most similar to Immigrants from Northern Europe are Honduran (74.8%, a difference of 0.0%), Immigrants from Honduras (74.9%, a difference of 0.010%), Russian (74.8%, a difference of 0.010%), Immigrants from Eastern Europe (74.9%, a difference of 0.020%), and Immigrants from Hungary (74.9%, a difference of 0.040%).
| Demographics | Rating | Rank | In Labor Force | Age 20-24 |
| Immigrants | South Africa | 36.9 /100 | #182 | Fair 74.9% |
| Immigrants | Costa Rica | 36.7 /100 | #183 | Fair 74.9% |
| Immigrants | Hungary | 35.0 /100 | #184 | Fair 74.9% |
| Sri Lankans | 34.9 /100 | #185 | Fair 74.9% |
| Immigrants | Eastern Europe | 33.8 /100 | #186 | Fair 74.9% |
| Immigrants | Honduras | 33.5 /100 | #187 | Fair 74.9% |
| Hondurans | 32.7 /100 | #188 | Fair 74.8% |
| Immigrants | Northern Europe | 32.6 /100 | #189 | Fair 74.8% |
| Russians | 32.2 /100 | #190 | Fair 74.8% |
| Senegalese | 28.1 /100 | #191 | Fair 74.8% |
| Immigrants | Europe | 27.5 /100 | #192 | Fair 74.8% |
| Alsatians | 27.1 /100 | #193 | Fair 74.8% |
| Immigrants | Denmark | 25.8 /100 | #194 | Fair 74.8% |
| Eastern Europeans | 25.4 /100 | #195 | Fair 74.8% |
| Immigrants | Vietnam | 25.1 /100 | #196 | Fair 74.7% |
Demographics Similar to Immigrants from Austria by In Labor Force | Age 20-24
In terms of in labor force | age 20-24, the demographic groups most similar to Immigrants from Austria are Iroquois (75.6%, a difference of 0.010%), Immigrants from Jordan (75.6%, a difference of 0.010%), Palestinian (75.6%, a difference of 0.010%), Immigrants from Afghanistan (75.6%, a difference of 0.020%), and Zimbabwean (75.6%, a difference of 0.020%).
| Demographics | Rating | Rank | In Labor Force | Age 20-24 |
| Immigrants | Bulgaria | 94.1 /100 | #123 | Exceptional 75.8% |
| Immigrants | Sierra Leone | 93.8 /100 | #124 | Exceptional 75.8% |
| Immigrants | Scotland | 93.7 /100 | #125 | Exceptional 75.8% |
| Brazilians | 93.0 /100 | #126 | Exceptional 75.8% |
| Sub-Saharan Africans | 90.9 /100 | #127 | Exceptional 75.7% |
| Immigrants | Afghanistan | 89.4 /100 | #128 | Excellent 75.6% |
| Iroquois | 89.1 /100 | #129 | Excellent 75.6% |
| Immigrants | Austria | 88.8 /100 | #130 | Excellent 75.6% |
| Immigrants | Jordan | 88.5 /100 | #131 | Excellent 75.6% |
| Palestinians | 88.4 /100 | #132 | Excellent 75.6% |
| Zimbabweans | 88.2 /100 | #133 | Excellent 75.6% |
| Estonians | 87.1 /100 | #134 | Excellent 75.6% |
| Yaqui | 85.5 /100 | #135 | Excellent 75.5% |
| Immigrants | Brazil | 84.8 /100 | #136 | Excellent 75.5% |
| Jordanians | 84.8 /100 | #137 | Excellent 75.5% |