Canadian vs Immigrants from Netherlands In Labor Force | Age 20-64
COMPARE
Canadian
Immigrants from Netherlands
In Labor Force | Age 20-64
In Labor Force | Age 20-64 Comparison
Canadians
Immigrants from Netherlands
79.1%
IN LABOR FORCE | AGE 20-64
6.8/ 100
METRIC RATING
223rd/ 347
METRIC RANK
79.5%
IN LABOR FORCE | AGE 20-64
45.2/ 100
METRIC RATING
177th/ 347
METRIC RANK
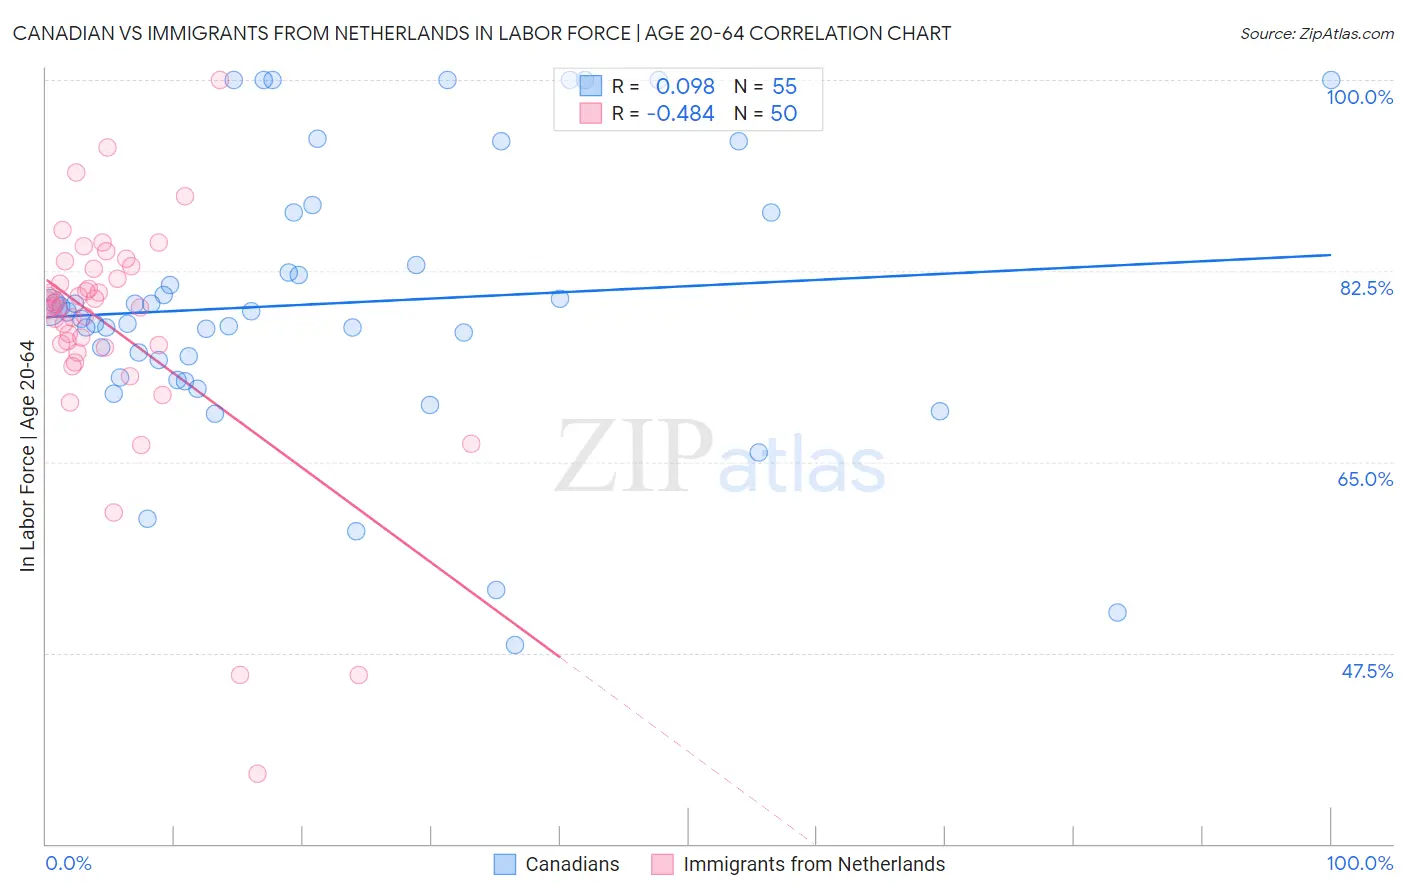
Canadian vs Immigrants from Netherlands In Labor Force | Age 20-64 Correlation Chart
The statistical analysis conducted on geographies consisting of 437,567,192 people shows a slight positive correlation between the proportion of Canadians and labor force participation rate among population between the ages 20 and 64 in the United States with a correlation coefficient (R) of 0.098 and weighted average of 79.1%. Similarly, the statistical analysis conducted on geographies consisting of 237,882,081 people shows a moderate negative correlation between the proportion of Immigrants from Netherlands and labor force participation rate among population between the ages 20 and 64 in the United States with a correlation coefficient (R) of -0.484 and weighted average of 79.5%, a difference of 0.49%.
In Labor Force | Age 20-64 Correlation Summary
| Measurement | Canadian | Immigrants from Netherlands |
| Minimum | 48.2% | 36.4% |
| Maximum | 100.0% | 100.0% |
| Range | 51.8% | 63.6% |
| Mean | 79.5% | 77.2% |
| Median | 78.8% | 79.2% |
| Interquartile 25% (IQ1) | 72.8% | 75.5% |
| Interquartile 75% (IQ3) | 87.9% | 82.7% |
| Interquartile Range (IQR) | 15.1% | 7.2% |
| Standard Deviation (Sample) | 12.5% | 11.1% |
| Standard Deviation (Population) | 12.4% | 11.0% |
Similar Demographics by In Labor Force | Age 20-64
Demographics Similar to Canadians by In Labor Force | Age 20-64
In terms of in labor force | age 20-64, the demographic groups most similar to Canadians are Immigrants from Panama (79.1%, a difference of 0.0%), Immigrants from Uzbekistan (79.1%, a difference of 0.0%), Hungarian (79.2%, a difference of 0.010%), Portuguese (79.1%, a difference of 0.020%), and Immigrants (79.2%, a difference of 0.030%).
| Demographics | Rating | Rank | In Labor Force | Age 20-64 |
| Arabs | 11.4 /100 | #216 | Poor 79.2% |
| Immigrants | Western Asia | 11.0 /100 | #217 | Poor 79.2% |
| Immigrants | England | 9.3 /100 | #218 | Tragic 79.2% |
| French Canadians | 8.4 /100 | #219 | Tragic 79.2% |
| Immigrants | Immigrants | 7.7 /100 | #220 | Tragic 79.2% |
| Hungarians | 7.2 /100 | #221 | Tragic 79.2% |
| Immigrants | Panama | 6.9 /100 | #222 | Tragic 79.1% |
| Canadians | 6.8 /100 | #223 | Tragic 79.1% |
| Immigrants | Uzbekistan | 6.8 /100 | #224 | Tragic 79.1% |
| Portuguese | 6.4 /100 | #225 | Tragic 79.1% |
| Central Americans | 5.9 /100 | #226 | Tragic 79.1% |
| Immigrants | Western Europe | 5.9 /100 | #227 | Tragic 79.1% |
| Panamanians | 5.7 /100 | #228 | Tragic 79.1% |
| Alsatians | 5.7 /100 | #229 | Tragic 79.1% |
| Native Hawaiians | 5.6 /100 | #230 | Tragic 79.1% |
Demographics Similar to Immigrants from Netherlands by In Labor Force | Age 20-64
In terms of in labor force | age 20-64, the demographic groups most similar to Immigrants from Netherlands are Cuban (79.5%, a difference of 0.010%), Australian (79.5%, a difference of 0.010%), Czechoslovakian (79.5%, a difference of 0.010%), Armenian (79.5%, a difference of 0.030%), and Salvadoran (79.5%, a difference of 0.030%).
| Demographics | Rating | Rank | In Labor Force | Age 20-64 |
| Slavs | 54.0 /100 | #170 | Average 79.6% |
| Immigrants | Switzerland | 53.3 /100 | #171 | Average 79.6% |
| Immigrants | Belgium | 53.1 /100 | #172 | Average 79.6% |
| Immigrants | Scotland | 52.4 /100 | #173 | Average 79.6% |
| Syrians | 50.0 /100 | #174 | Average 79.6% |
| Cubans | 46.1 /100 | #175 | Average 79.5% |
| Australians | 46.0 /100 | #176 | Average 79.5% |
| Immigrants | Netherlands | 45.2 /100 | #177 | Average 79.5% |
| Czechoslovakians | 44.3 /100 | #178 | Average 79.5% |
| Armenians | 41.4 /100 | #179 | Average 79.5% |
| Salvadorans | 41.0 /100 | #180 | Average 79.5% |
| Immigrants | Saudi Arabia | 37.7 /100 | #181 | Fair 79.5% |
| Malaysians | 37.1 /100 | #182 | Fair 79.5% |
| Immigrants | Hungary | 36.8 /100 | #183 | Fair 79.5% |
| Finns | 35.9 /100 | #184 | Fair 79.5% |