Canadian vs Cuban In Labor Force | Age 20-64
COMPARE
Canadian
Cuban
In Labor Force | Age 20-64
In Labor Force | Age 20-64 Comparison
Canadians
Cubans
79.1%
IN LABOR FORCE | AGE 20-64
6.8/ 100
METRIC RATING
223rd/ 347
METRIC RANK
79.5%
IN LABOR FORCE | AGE 20-64
46.1/ 100
METRIC RATING
175th/ 347
METRIC RANK
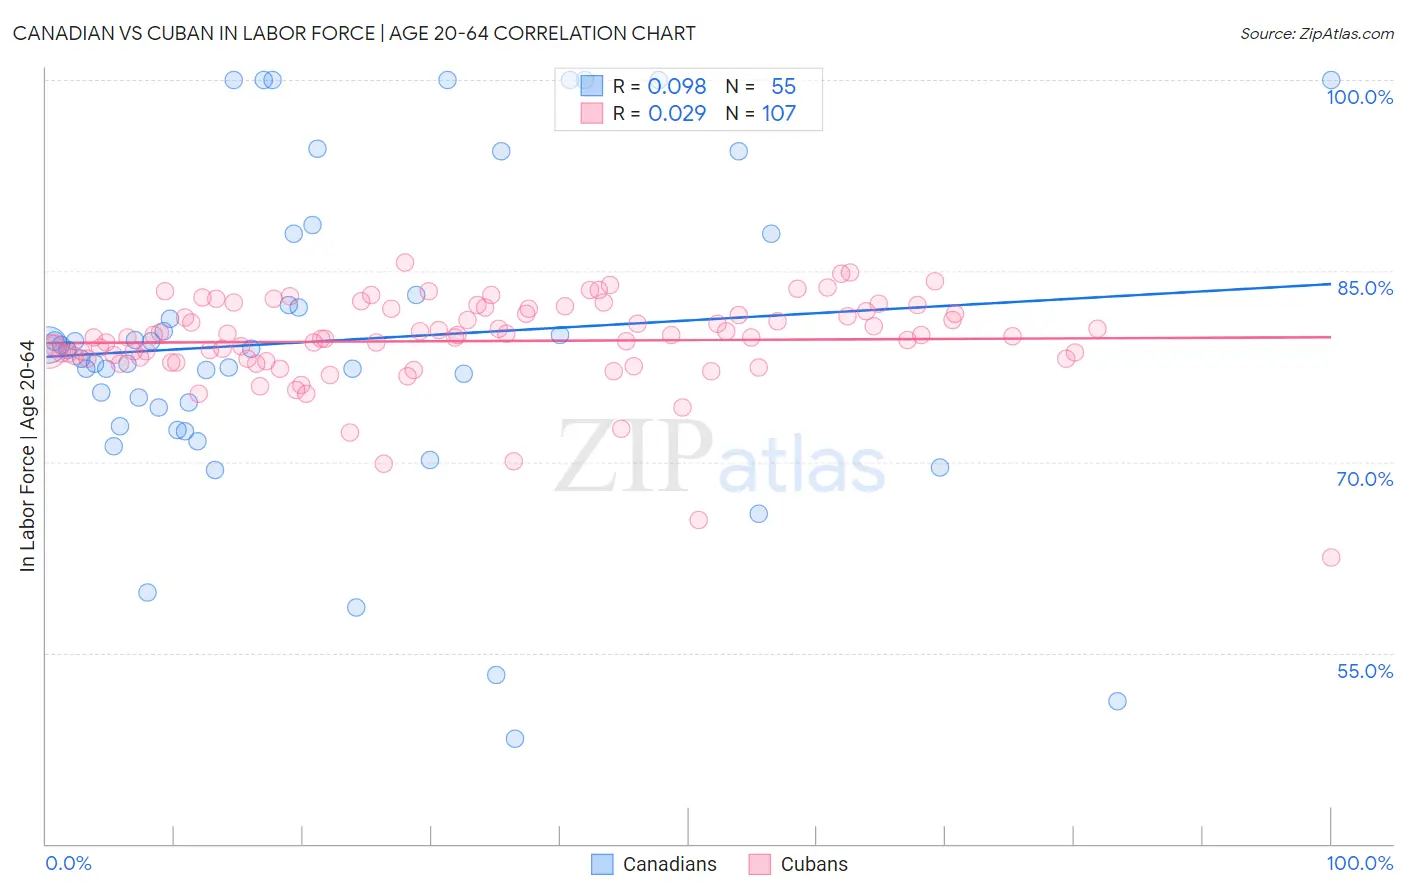
Canadian vs Cuban In Labor Force | Age 20-64 Correlation Chart
The statistical analysis conducted on geographies consisting of 437,567,192 people shows a slight positive correlation between the proportion of Canadians and labor force participation rate among population between the ages 20 and 64 in the United States with a correlation coefficient (R) of 0.098 and weighted average of 79.1%. Similarly, the statistical analysis conducted on geographies consisting of 449,374,603 people shows no correlation between the proportion of Cubans and labor force participation rate among population between the ages 20 and 64 in the United States with a correlation coefficient (R) of 0.029 and weighted average of 79.5%, a difference of 0.50%.
In Labor Force | Age 20-64 Correlation Summary
| Measurement | Canadian | Cuban |
| Minimum | 48.2% | 62.5% |
| Maximum | 100.0% | 85.7% |
| Range | 51.8% | 23.2% |
| Mean | 79.5% | 79.5% |
| Median | 78.8% | 79.8% |
| Interquartile 25% (IQ1) | 72.8% | 78.1% |
| Interquartile 75% (IQ3) | 87.9% | 82.0% |
| Interquartile Range (IQR) | 15.1% | 3.9% |
| Standard Deviation (Sample) | 12.5% | 3.6% |
| Standard Deviation (Population) | 12.4% | 3.6% |
Similar Demographics by In Labor Force | Age 20-64
Demographics Similar to Canadians by In Labor Force | Age 20-64
In terms of in labor force | age 20-64, the demographic groups most similar to Canadians are Immigrants from Panama (79.1%, a difference of 0.0%), Immigrants from Uzbekistan (79.1%, a difference of 0.0%), Hungarian (79.2%, a difference of 0.010%), Portuguese (79.1%, a difference of 0.020%), and Immigrants (79.2%, a difference of 0.030%).
| Demographics | Rating | Rank | In Labor Force | Age 20-64 |
| Arabs | 11.4 /100 | #216 | Poor 79.2% |
| Immigrants | Western Asia | 11.0 /100 | #217 | Poor 79.2% |
| Immigrants | England | 9.3 /100 | #218 | Tragic 79.2% |
| French Canadians | 8.4 /100 | #219 | Tragic 79.2% |
| Immigrants | Immigrants | 7.7 /100 | #220 | Tragic 79.2% |
| Hungarians | 7.2 /100 | #221 | Tragic 79.2% |
| Immigrants | Panama | 6.9 /100 | #222 | Tragic 79.1% |
| Canadians | 6.8 /100 | #223 | Tragic 79.1% |
| Immigrants | Uzbekistan | 6.8 /100 | #224 | Tragic 79.1% |
| Portuguese | 6.4 /100 | #225 | Tragic 79.1% |
| Central Americans | 5.9 /100 | #226 | Tragic 79.1% |
| Immigrants | Western Europe | 5.9 /100 | #227 | Tragic 79.1% |
| Panamanians | 5.7 /100 | #228 | Tragic 79.1% |
| Alsatians | 5.7 /100 | #229 | Tragic 79.1% |
| Native Hawaiians | 5.6 /100 | #230 | Tragic 79.1% |
Demographics Similar to Cubans by In Labor Force | Age 20-64
In terms of in labor force | age 20-64, the demographic groups most similar to Cubans are Australian (79.5%, a difference of 0.0%), Immigrants from Netherlands (79.5%, a difference of 0.010%), Czechoslovakian (79.5%, a difference of 0.010%), Syrian (79.6%, a difference of 0.030%), and Armenian (79.5%, a difference of 0.040%).
| Demographics | Rating | Rank | In Labor Force | Age 20-64 |
| Immigrants | Indonesia | 61.8 /100 | #168 | Good 79.6% |
| Laotians | 58.4 /100 | #169 | Average 79.6% |
| Slavs | 54.0 /100 | #170 | Average 79.6% |
| Immigrants | Switzerland | 53.3 /100 | #171 | Average 79.6% |
| Immigrants | Belgium | 53.1 /100 | #172 | Average 79.6% |
| Immigrants | Scotland | 52.4 /100 | #173 | Average 79.6% |
| Syrians | 50.0 /100 | #174 | Average 79.6% |
| Cubans | 46.1 /100 | #175 | Average 79.5% |
| Australians | 46.0 /100 | #176 | Average 79.5% |
| Immigrants | Netherlands | 45.2 /100 | #177 | Average 79.5% |
| Czechoslovakians | 44.3 /100 | #178 | Average 79.5% |
| Armenians | 41.4 /100 | #179 | Average 79.5% |
| Salvadorans | 41.0 /100 | #180 | Average 79.5% |
| Immigrants | Saudi Arabia | 37.7 /100 | #181 | Fair 79.5% |
| Malaysians | 37.1 /100 | #182 | Fair 79.5% |