Pennsylvania German vs Immigrants from Netherlands In Labor Force | Age 20-64
COMPARE
Pennsylvania German
Immigrants from Netherlands
In Labor Force | Age 20-64
In Labor Force | Age 20-64 Comparison
Pennsylvania Germans
Immigrants from Netherlands
78.4%
IN LABOR FORCE | AGE 20-64
0.1/ 100
METRIC RATING
263rd/ 347
METRIC RANK
79.5%
IN LABOR FORCE | AGE 20-64
45.2/ 100
METRIC RATING
177th/ 347
METRIC RANK
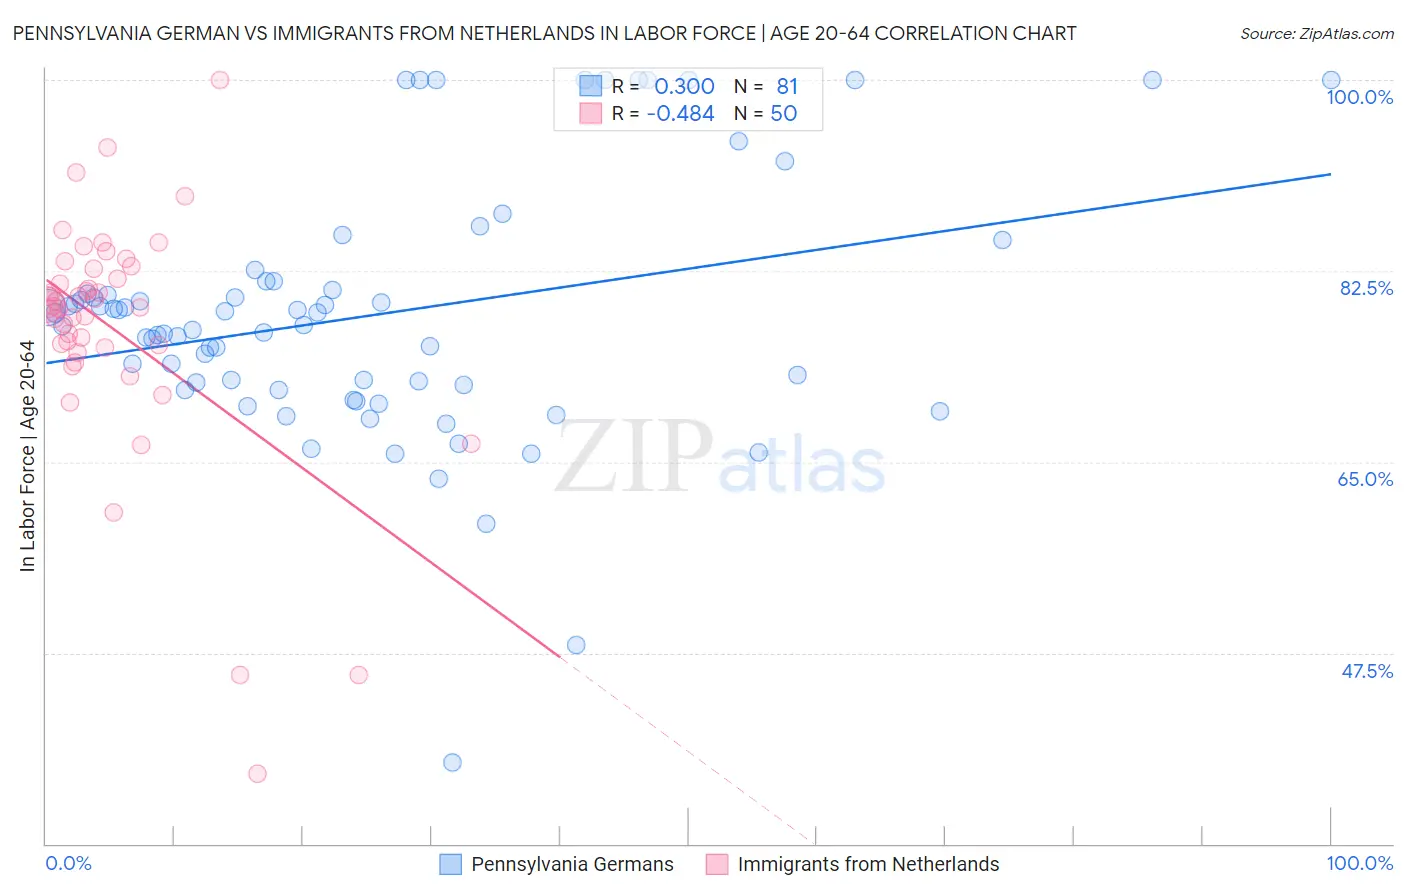
Pennsylvania German vs Immigrants from Netherlands In Labor Force | Age 20-64 Correlation Chart
The statistical analysis conducted on geographies consisting of 234,107,007 people shows a mild positive correlation between the proportion of Pennsylvania Germans and labor force participation rate among population between the ages 20 and 64 in the United States with a correlation coefficient (R) of 0.300 and weighted average of 78.4%. Similarly, the statistical analysis conducted on geographies consisting of 237,882,081 people shows a moderate negative correlation between the proportion of Immigrants from Netherlands and labor force participation rate among population between the ages 20 and 64 in the United States with a correlation coefficient (R) of -0.484 and weighted average of 79.5%, a difference of 1.4%.
In Labor Force | Age 20-64 Correlation Summary
| Measurement | Pennsylvania German | Immigrants from Netherlands |
| Minimum | 37.5% | 36.4% |
| Maximum | 100.0% | 100.0% |
| Range | 62.5% | 63.6% |
| Mean | 78.4% | 77.2% |
| Median | 77.5% | 79.2% |
| Interquartile 25% (IQ1) | 71.8% | 75.5% |
| Interquartile 75% (IQ3) | 81.2% | 82.7% |
| Interquartile Range (IQR) | 9.3% | 7.2% |
| Standard Deviation (Sample) | 11.7% | 11.1% |
| Standard Deviation (Population) | 11.6% | 11.0% |
Similar Demographics by In Labor Force | Age 20-64
Demographics Similar to Pennsylvania Germans by In Labor Force | Age 20-64
In terms of in labor force | age 20-64, the demographic groups most similar to Pennsylvania Germans are Fijian (78.4%, a difference of 0.010%), Spaniard (78.4%, a difference of 0.010%), British West Indian (78.4%, a difference of 0.050%), Bahamian (78.4%, a difference of 0.050%), and U.S. Virgin Islander (78.4%, a difference of 0.070%).
| Demographics | Rating | Rank | In Labor Force | Age 20-64 |
| Celtics | 0.5 /100 | #256 | Tragic 78.7% |
| Guatemalans | 0.4 /100 | #257 | Tragic 78.7% |
| Immigrants | Guatemala | 0.4 /100 | #258 | Tragic 78.7% |
| Tsimshian | 0.4 /100 | #259 | Tragic 78.7% |
| Immigrants | Fiji | 0.3 /100 | #260 | Tragic 78.6% |
| Whites/Caucasians | 0.2 /100 | #261 | Tragic 78.5% |
| Fijians | 0.1 /100 | #262 | Tragic 78.4% |
| Pennsylvania Germans | 0.1 /100 | #263 | Tragic 78.4% |
| Spaniards | 0.1 /100 | #264 | Tragic 78.4% |
| British West Indians | 0.1 /100 | #265 | Tragic 78.4% |
| Bahamians | 0.1 /100 | #266 | Tragic 78.4% |
| U.S. Virgin Islanders | 0.1 /100 | #267 | Tragic 78.4% |
| West Indians | 0.0 /100 | #268 | Tragic 78.3% |
| Immigrants | Barbados | 0.0 /100 | #269 | Tragic 78.3% |
| Scotch-Irish | 0.0 /100 | #270 | Tragic 78.3% |
Demographics Similar to Immigrants from Netherlands by In Labor Force | Age 20-64
In terms of in labor force | age 20-64, the demographic groups most similar to Immigrants from Netherlands are Cuban (79.5%, a difference of 0.010%), Australian (79.5%, a difference of 0.010%), Czechoslovakian (79.5%, a difference of 0.010%), Armenian (79.5%, a difference of 0.030%), and Salvadoran (79.5%, a difference of 0.030%).
| Demographics | Rating | Rank | In Labor Force | Age 20-64 |
| Slavs | 54.0 /100 | #170 | Average 79.6% |
| Immigrants | Switzerland | 53.3 /100 | #171 | Average 79.6% |
| Immigrants | Belgium | 53.1 /100 | #172 | Average 79.6% |
| Immigrants | Scotland | 52.4 /100 | #173 | Average 79.6% |
| Syrians | 50.0 /100 | #174 | Average 79.6% |
| Cubans | 46.1 /100 | #175 | Average 79.5% |
| Australians | 46.0 /100 | #176 | Average 79.5% |
| Immigrants | Netherlands | 45.2 /100 | #177 | Average 79.5% |
| Czechoslovakians | 44.3 /100 | #178 | Average 79.5% |
| Armenians | 41.4 /100 | #179 | Average 79.5% |
| Salvadorans | 41.0 /100 | #180 | Average 79.5% |
| Immigrants | Saudi Arabia | 37.7 /100 | #181 | Fair 79.5% |
| Malaysians | 37.1 /100 | #182 | Fair 79.5% |
| Immigrants | Hungary | 36.8 /100 | #183 | Fair 79.5% |
| Finns | 35.9 /100 | #184 | Fair 79.5% |