Carpatho Rusyn vs Immigrants from Netherlands In Labor Force | Age 20-64
COMPARE
Carpatho Rusyn
Immigrants from Netherlands
In Labor Force | Age 20-64
In Labor Force | Age 20-64 Comparison
Carpatho Rusyns
Immigrants from Netherlands
80.3%
IN LABOR FORCE | AGE 20-64
98.8/ 100
METRIC RATING
62nd/ 347
METRIC RANK
79.5%
IN LABOR FORCE | AGE 20-64
45.2/ 100
METRIC RATING
177th/ 347
METRIC RANK
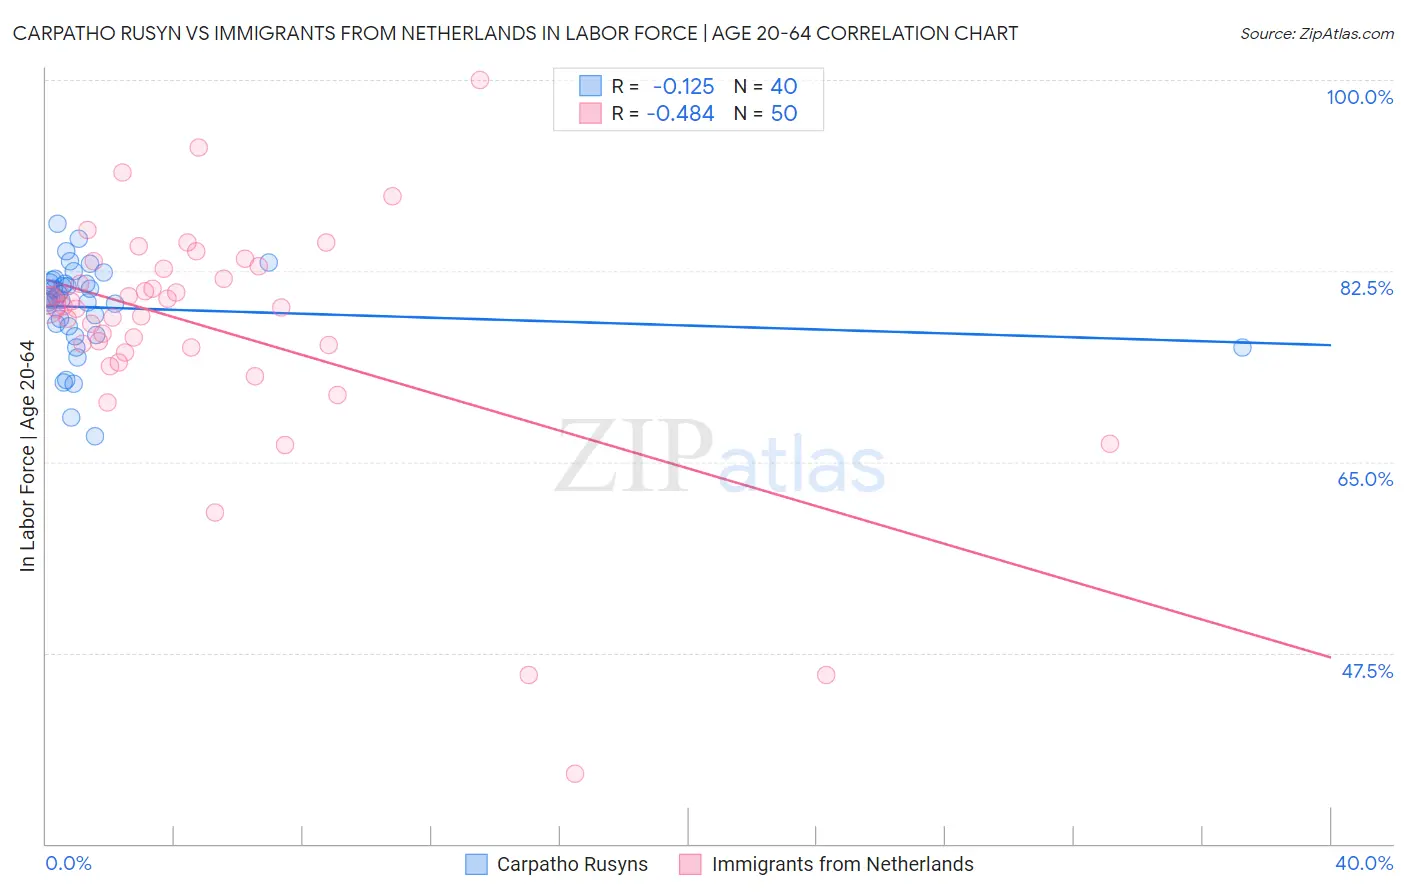
Carpatho Rusyn vs Immigrants from Netherlands In Labor Force | Age 20-64 Correlation Chart
The statistical analysis conducted on geographies consisting of 58,872,065 people shows a poor negative correlation between the proportion of Carpatho Rusyns and labor force participation rate among population between the ages 20 and 64 in the United States with a correlation coefficient (R) of -0.125 and weighted average of 80.3%. Similarly, the statistical analysis conducted on geographies consisting of 237,882,081 people shows a moderate negative correlation between the proportion of Immigrants from Netherlands and labor force participation rate among population between the ages 20 and 64 in the United States with a correlation coefficient (R) of -0.484 and weighted average of 79.5%, a difference of 0.93%.
In Labor Force | Age 20-64 Correlation Summary
| Measurement | Carpatho Rusyn | Immigrants from Netherlands |
| Minimum | 67.3% | 36.4% |
| Maximum | 86.8% | 100.0% |
| Range | 19.5% | 63.6% |
| Mean | 79.1% | 77.2% |
| Median | 80.0% | 79.2% |
| Interquartile 25% (IQ1) | 77.0% | 75.5% |
| Interquartile 75% (IQ3) | 81.6% | 82.7% |
| Interquartile Range (IQR) | 4.5% | 7.2% |
| Standard Deviation (Sample) | 4.2% | 11.1% |
| Standard Deviation (Population) | 4.2% | 11.0% |
Similar Demographics by In Labor Force | Age 20-64
Demographics Similar to Carpatho Rusyns by In Labor Force | Age 20-64
In terms of in labor force | age 20-64, the demographic groups most similar to Carpatho Rusyns are Tongan (80.3%, a difference of 0.0%), Burmese (80.3%, a difference of 0.0%), Serbian (80.3%, a difference of 0.010%), Swedish (80.3%, a difference of 0.010%), and Immigrants from Korea (80.3%, a difference of 0.010%).
| Demographics | Rating | Rank | In Labor Force | Age 20-64 |
| Immigrants | Cabo Verde | 99.0 /100 | #55 | Exceptional 80.3% |
| Immigrants | Northern Africa | 99.0 /100 | #56 | Exceptional 80.3% |
| Afghans | 98.9 /100 | #57 | Exceptional 80.3% |
| Serbians | 98.9 /100 | #58 | Exceptional 80.3% |
| Swedes | 98.9 /100 | #59 | Exceptional 80.3% |
| Tongans | 98.8 /100 | #60 | Exceptional 80.3% |
| Burmese | 98.8 /100 | #61 | Exceptional 80.3% |
| Carpatho Rusyns | 98.8 /100 | #62 | Exceptional 80.3% |
| Immigrants | Korea | 98.8 /100 | #63 | Exceptional 80.3% |
| Immigrants | Albania | 98.7 /100 | #64 | Exceptional 80.3% |
| Lithuanians | 98.7 /100 | #65 | Exceptional 80.2% |
| Macedonians | 98.7 /100 | #66 | Exceptional 80.2% |
| Taiwanese | 98.6 /100 | #67 | Exceptional 80.2% |
| Bhutanese | 98.6 /100 | #68 | Exceptional 80.2% |
| Albanians | 98.6 /100 | #69 | Exceptional 80.2% |
Demographics Similar to Immigrants from Netherlands by In Labor Force | Age 20-64
In terms of in labor force | age 20-64, the demographic groups most similar to Immigrants from Netherlands are Cuban (79.5%, a difference of 0.010%), Australian (79.5%, a difference of 0.010%), Czechoslovakian (79.5%, a difference of 0.010%), Armenian (79.5%, a difference of 0.030%), and Salvadoran (79.5%, a difference of 0.030%).
| Demographics | Rating | Rank | In Labor Force | Age 20-64 |
| Slavs | 54.0 /100 | #170 | Average 79.6% |
| Immigrants | Switzerland | 53.3 /100 | #171 | Average 79.6% |
| Immigrants | Belgium | 53.1 /100 | #172 | Average 79.6% |
| Immigrants | Scotland | 52.4 /100 | #173 | Average 79.6% |
| Syrians | 50.0 /100 | #174 | Average 79.6% |
| Cubans | 46.1 /100 | #175 | Average 79.5% |
| Australians | 46.0 /100 | #176 | Average 79.5% |
| Immigrants | Netherlands | 45.2 /100 | #177 | Average 79.5% |
| Czechoslovakians | 44.3 /100 | #178 | Average 79.5% |
| Armenians | 41.4 /100 | #179 | Average 79.5% |
| Salvadorans | 41.0 /100 | #180 | Average 79.5% |
| Immigrants | Saudi Arabia | 37.7 /100 | #181 | Fair 79.5% |
| Malaysians | 37.1 /100 | #182 | Fair 79.5% |
| Immigrants | Hungary | 36.8 /100 | #183 | Fair 79.5% |
| Finns | 35.9 /100 | #184 | Fair 79.5% |