Canadian vs Basque In Labor Force | Age 20-64
COMPARE
Canadian
Basque
In Labor Force | Age 20-64
In Labor Force | Age 20-64 Comparison
Canadians
Basques
79.1%
IN LABOR FORCE | AGE 20-64
6.8/ 100
METRIC RATING
223rd/ 347
METRIC RANK
78.7%
IN LABOR FORCE | AGE 20-64
0.5/ 100
METRIC RATING
253rd/ 347
METRIC RANK
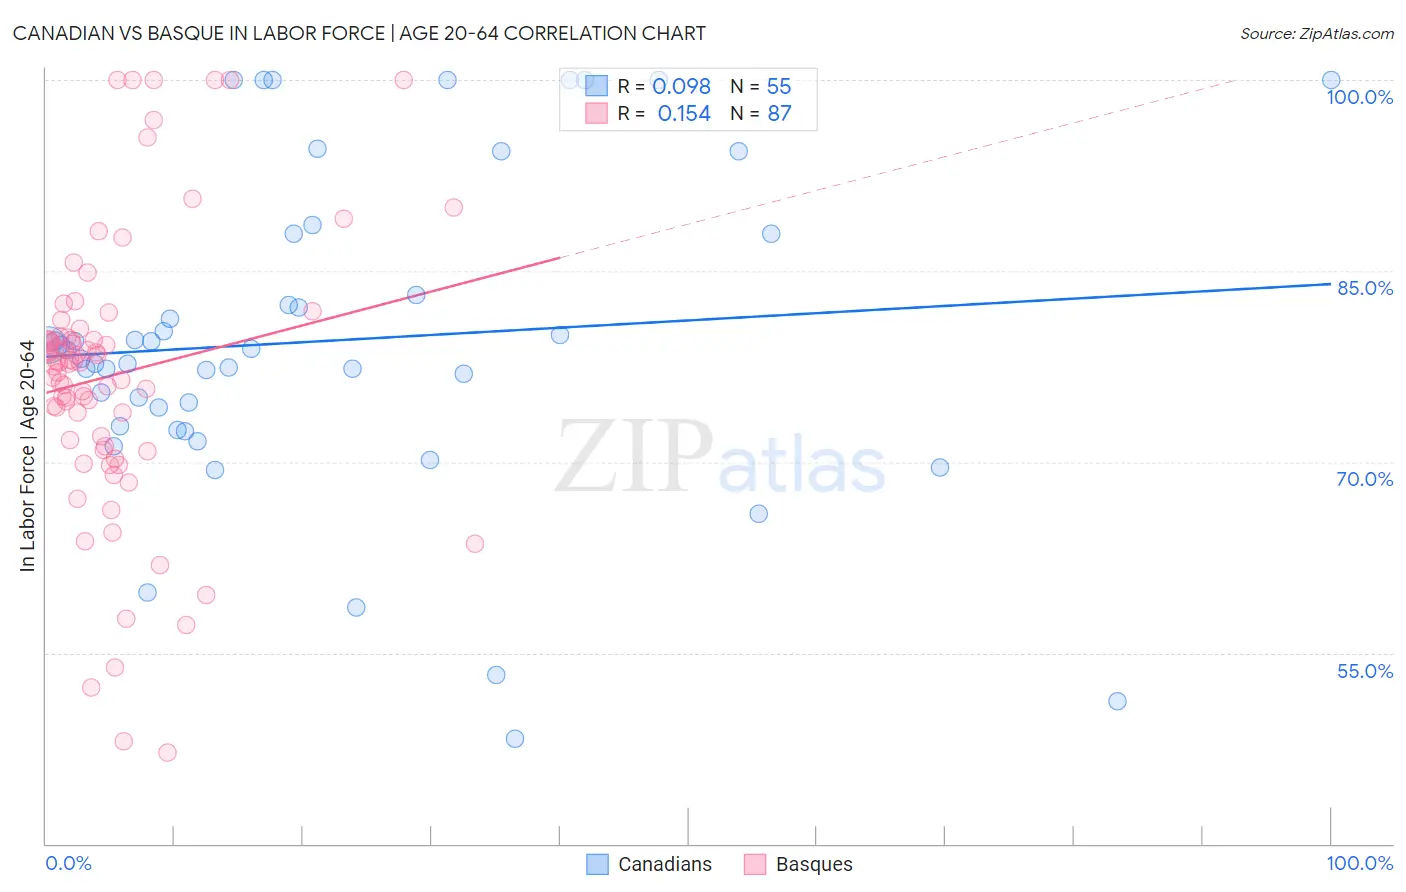
Canadian vs Basque In Labor Force | Age 20-64 Correlation Chart
The statistical analysis conducted on geographies consisting of 437,567,192 people shows a slight positive correlation between the proportion of Canadians and labor force participation rate among population between the ages 20 and 64 in the United States with a correlation coefficient (R) of 0.098 and weighted average of 79.1%. Similarly, the statistical analysis conducted on geographies consisting of 165,779,636 people shows a poor positive correlation between the proportion of Basques and labor force participation rate among population between the ages 20 and 64 in the United States with a correlation coefficient (R) of 0.154 and weighted average of 78.7%, a difference of 0.53%.
In Labor Force | Age 20-64 Correlation Summary
| Measurement | Canadian | Basque |
| Minimum | 48.2% | 47.2% |
| Maximum | 100.0% | 100.0% |
| Range | 51.8% | 52.8% |
| Mean | 79.5% | 76.8% |
| Median | 78.8% | 77.8% |
| Interquartile 25% (IQ1) | 72.8% | 71.2% |
| Interquartile 75% (IQ3) | 87.9% | 79.8% |
| Interquartile Range (IQR) | 15.1% | 8.6% |
| Standard Deviation (Sample) | 12.5% | 11.0% |
| Standard Deviation (Population) | 12.4% | 11.0% |
Similar Demographics by In Labor Force | Age 20-64
Demographics Similar to Canadians by In Labor Force | Age 20-64
In terms of in labor force | age 20-64, the demographic groups most similar to Canadians are Immigrants from Panama (79.1%, a difference of 0.0%), Immigrants from Uzbekistan (79.1%, a difference of 0.0%), Hungarian (79.2%, a difference of 0.010%), Portuguese (79.1%, a difference of 0.020%), and Immigrants (79.2%, a difference of 0.030%).
| Demographics | Rating | Rank | In Labor Force | Age 20-64 |
| Arabs | 11.4 /100 | #216 | Poor 79.2% |
| Immigrants | Western Asia | 11.0 /100 | #217 | Poor 79.2% |
| Immigrants | England | 9.3 /100 | #218 | Tragic 79.2% |
| French Canadians | 8.4 /100 | #219 | Tragic 79.2% |
| Immigrants | Immigrants | 7.7 /100 | #220 | Tragic 79.2% |
| Hungarians | 7.2 /100 | #221 | Tragic 79.2% |
| Immigrants | Panama | 6.9 /100 | #222 | Tragic 79.1% |
| Canadians | 6.8 /100 | #223 | Tragic 79.1% |
| Immigrants | Uzbekistan | 6.8 /100 | #224 | Tragic 79.1% |
| Portuguese | 6.4 /100 | #225 | Tragic 79.1% |
| Central Americans | 5.9 /100 | #226 | Tragic 79.1% |
| Immigrants | Western Europe | 5.9 /100 | #227 | Tragic 79.1% |
| Panamanians | 5.7 /100 | #228 | Tragic 79.1% |
| Alsatians | 5.7 /100 | #229 | Tragic 79.1% |
| Native Hawaiians | 5.6 /100 | #230 | Tragic 79.1% |
Demographics Similar to Basques by In Labor Force | Age 20-64
In terms of in labor force | age 20-64, the demographic groups most similar to Basques are Immigrants from Lebanon (78.7%, a difference of 0.0%), Immigrants from Honduras (78.7%, a difference of 0.010%), Hawaiian (78.7%, a difference of 0.020%), Celtic (78.7%, a difference of 0.020%), and Guatemalan (78.7%, a difference of 0.040%).
| Demographics | Rating | Rank | In Labor Force | Age 20-64 |
| Immigrants | Trinidad and Tobago | 1.1 /100 | #246 | Tragic 78.8% |
| Immigrants | Germany | 1.0 /100 | #247 | Tragic 78.8% |
| Immigrants | Caribbean | 1.0 /100 | #248 | Tragic 78.8% |
| English | 0.9 /100 | #249 | Tragic 78.8% |
| Hondurans | 0.8 /100 | #250 | Tragic 78.8% |
| Barbadians | 0.7 /100 | #251 | Tragic 78.8% |
| Immigrants | Honduras | 0.6 /100 | #252 | Tragic 78.7% |
| Basques | 0.5 /100 | #253 | Tragic 78.7% |
| Immigrants | Lebanon | 0.5 /100 | #254 | Tragic 78.7% |
| Hawaiians | 0.5 /100 | #255 | Tragic 78.7% |
| Celtics | 0.5 /100 | #256 | Tragic 78.7% |
| Guatemalans | 0.4 /100 | #257 | Tragic 78.7% |
| Immigrants | Guatemala | 0.4 /100 | #258 | Tragic 78.7% |
| Tsimshian | 0.4 /100 | #259 | Tragic 78.7% |
| Immigrants | Fiji | 0.3 /100 | #260 | Tragic 78.6% |