Canadian vs Immigrants from Netherlands In Labor Force | Age 16-19
COMPARE
Canadian
Immigrants from Netherlands
In Labor Force | Age 16-19
In Labor Force | Age 16-19 Comparison
Canadians
Immigrants from Netherlands
40.1%
IN LABOR FORCE | AGE 16-19
100.0/ 100
METRIC RATING
67th/ 347
METRIC RANK
37.8%
IN LABOR FORCE | AGE 16-19
93.7/ 100
METRIC RATING
134th/ 347
METRIC RANK
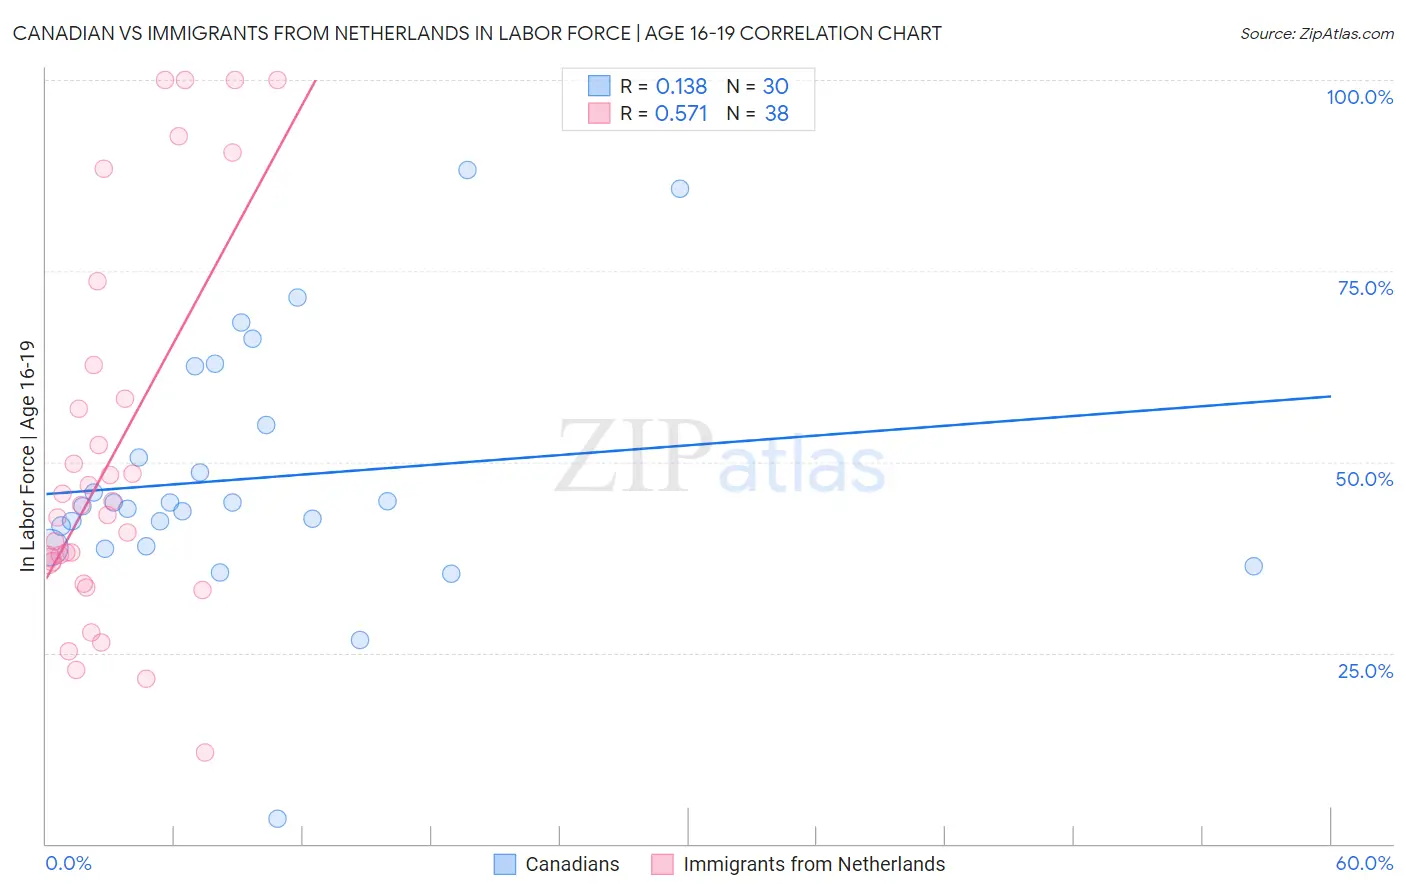
Canadian vs Immigrants from Netherlands In Labor Force | Age 16-19 Correlation Chart
The statistical analysis conducted on geographies consisting of 436,563,556 people shows a poor positive correlation between the proportion of Canadians and labor force participation rate among population between the ages 16 and 19 in the United States with a correlation coefficient (R) of 0.138 and weighted average of 40.1%. Similarly, the statistical analysis conducted on geographies consisting of 237,512,378 people shows a substantial positive correlation between the proportion of Immigrants from Netherlands and labor force participation rate among population between the ages 16 and 19 in the United States with a correlation coefficient (R) of 0.571 and weighted average of 37.8%, a difference of 6.0%.
In Labor Force | Age 16-19 Correlation Summary
| Measurement | Canadian | Immigrants from Netherlands |
| Minimum | 3.2% | 12.0% |
| Maximum | 88.2% | 100.0% |
| Range | 85.0% | 88.0% |
| Mean | 47.9% | 50.8% |
| Median | 44.4% | 43.7% |
| Interquartile 25% (IQ1) | 39.0% | 36.9% |
| Interquartile 75% (IQ3) | 54.8% | 58.3% |
| Interquartile Range (IQR) | 15.8% | 21.4% |
| Standard Deviation (Sample) | 16.8% | 24.7% |
| Standard Deviation (Population) | 16.6% | 24.3% |
Similar Demographics by In Labor Force | Age 16-19
Demographics Similar to Canadians by In Labor Force | Age 16-19
In terms of in labor force | age 16-19, the demographic groups most similar to Canadians are Nonimmigrants (40.1%, a difference of 0.010%), Italian (40.1%, a difference of 0.060%), Kenyan (40.1%, a difference of 0.13%), Potawatomi (40.0%, a difference of 0.13%), and Portuguese (40.0%, a difference of 0.18%).
| Demographics | Rating | Rank | In Labor Force | Age 16-19 |
| Immigrants | Eastern Africa | 100.0 /100 | #60 | Exceptional 40.4% |
| Americans | 100.0 /100 | #61 | Exceptional 40.3% |
| Cherokee | 100.0 /100 | #62 | Exceptional 40.2% |
| Northern Europeans | 100.0 /100 | #63 | Exceptional 40.2% |
| Immigrants | Micronesia | 100.0 /100 | #64 | Exceptional 40.2% |
| Kenyans | 100.0 /100 | #65 | Exceptional 40.1% |
| Immigrants | Nonimmigrants | 100.0 /100 | #66 | Exceptional 40.1% |
| Canadians | 100.0 /100 | #67 | Exceptional 40.1% |
| Italians | 99.9 /100 | #68 | Exceptional 40.1% |
| Potawatomi | 99.9 /100 | #69 | Exceptional 40.0% |
| Portuguese | 99.9 /100 | #70 | Exceptional 40.0% |
| Serbians | 99.9 /100 | #71 | Exceptional 39.9% |
| Iroquois | 99.9 /100 | #72 | Exceptional 39.9% |
| Immigrants | Middle Africa | 99.9 /100 | #73 | Exceptional 39.9% |
| Hungarians | 99.9 /100 | #74 | Exceptional 39.8% |
Demographics Similar to Immigrants from Netherlands by In Labor Force | Age 16-19
In terms of in labor force | age 16-19, the demographic groups most similar to Immigrants from Netherlands are Macedonian (37.8%, a difference of 0.060%), Australian (37.8%, a difference of 0.090%), Cajun (37.8%, a difference of 0.090%), Cheyenne (37.9%, a difference of 0.21%), and Immigrants from Oceania (37.9%, a difference of 0.23%).
| Demographics | Rating | Rank | In Labor Force | Age 16-19 |
| Choctaw | 95.6 /100 | #127 | Exceptional 38.0% |
| New Zealanders | 95.6 /100 | #128 | Exceptional 38.0% |
| Spaniards | 95.5 /100 | #129 | Exceptional 38.0% |
| Immigrants | Zimbabwe | 95.4 /100 | #130 | Exceptional 38.0% |
| Immigrants | Austria | 95.0 /100 | #131 | Exceptional 37.9% |
| Immigrants | Oceania | 94.7 /100 | #132 | Exceptional 37.9% |
| Cheyenne | 94.6 /100 | #133 | Exceptional 37.9% |
| Immigrants | Netherlands | 93.7 /100 | #134 | Exceptional 37.8% |
| Macedonians | 93.4 /100 | #135 | Exceptional 37.8% |
| Australians | 93.2 /100 | #136 | Exceptional 37.8% |
| Cajuns | 93.2 /100 | #137 | Exceptional 37.8% |
| Comanche | 91.9 /100 | #138 | Exceptional 37.7% |
| Immigrants | Moldova | 91.9 /100 | #139 | Exceptional 37.7% |
| Estonians | 91.7 /100 | #140 | Exceptional 37.7% |
| Syrians | 90.7 /100 | #141 | Exceptional 37.6% |