Cambodian vs Immigrants from Belize In Labor Force | Age 20-24
COMPARE
Cambodian
Immigrants from Belize
In Labor Force | Age 20-24
In Labor Force | Age 20-24 Comparison
Cambodians
Immigrants from Belize
75.2%
IN LABOR FORCE | AGE 20-24
60.5/ 100
METRIC RATING
166th/ 347
METRIC RANK
72.8%
IN LABOR FORCE | AGE 20-24
0.0/ 100
METRIC RATING
293rd/ 347
METRIC RANK
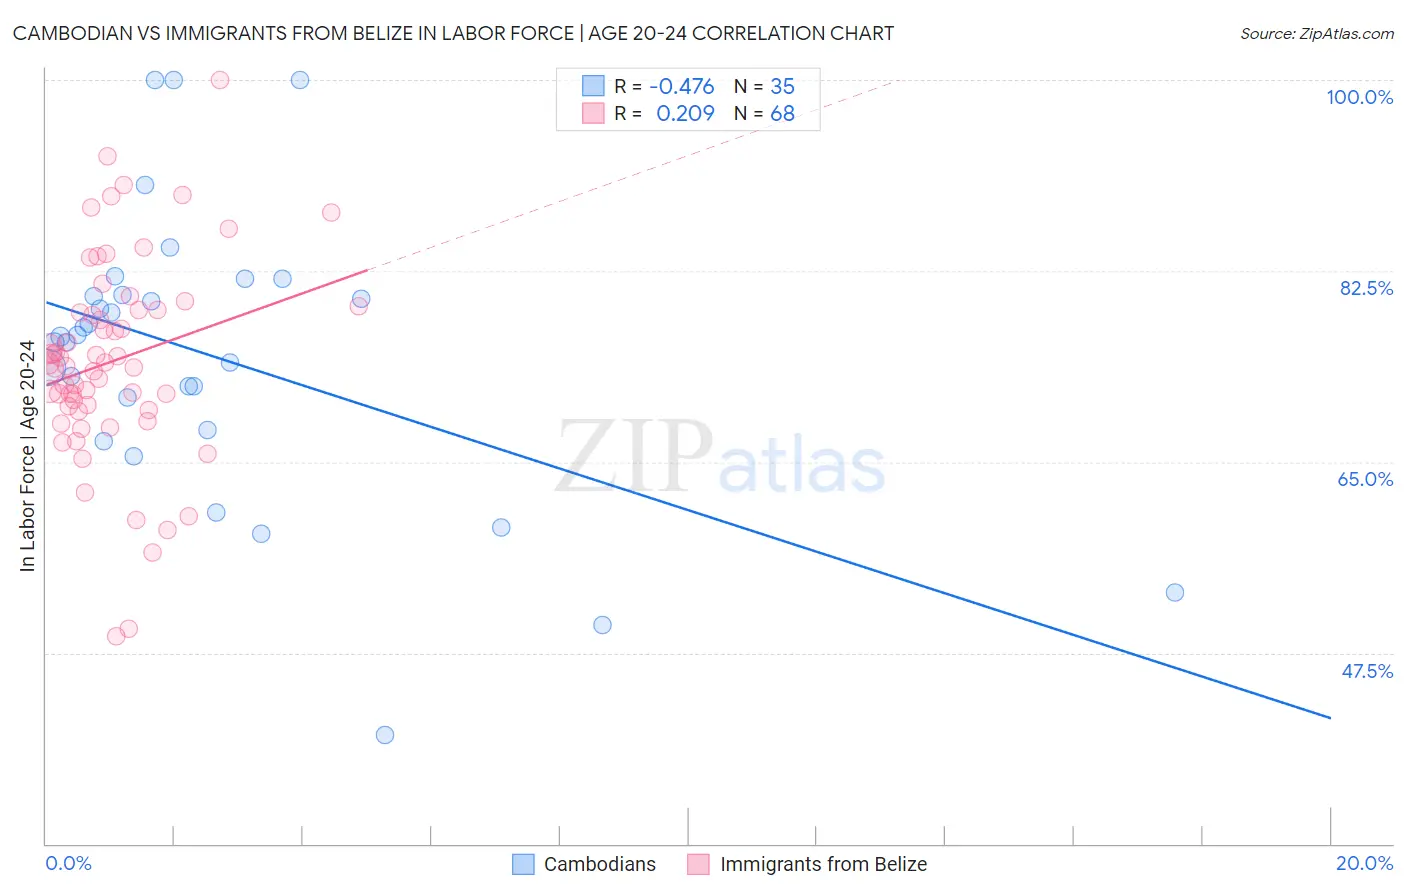
Cambodian vs Immigrants from Belize In Labor Force | Age 20-24 Correlation Chart
The statistical analysis conducted on geographies consisting of 102,513,868 people shows a moderate negative correlation between the proportion of Cambodians and labor force participation rate among population between the ages 20 and 24 in the United States with a correlation coefficient (R) of -0.476 and weighted average of 75.2%. Similarly, the statistical analysis conducted on geographies consisting of 130,312,763 people shows a weak positive correlation between the proportion of Immigrants from Belize and labor force participation rate among population between the ages 20 and 24 in the United States with a correlation coefficient (R) of 0.209 and weighted average of 72.8%, a difference of 3.2%.
In Labor Force | Age 20-24 Correlation Summary
| Measurement | Cambodian | Immigrants from Belize |
| Minimum | 40.0% | 49.0% |
| Maximum | 100.0% | 100.0% |
| Range | 60.0% | 51.0% |
| Mean | 74.7% | 74.2% |
| Median | 76.5% | 73.9% |
| Interquartile 25% (IQ1) | 68.0% | 69.9% |
| Interquartile 75% (IQ3) | 80.3% | 78.9% |
| Interquartile Range (IQR) | 12.4% | 9.0% |
| Standard Deviation (Sample) | 13.1% | 9.3% |
| Standard Deviation (Population) | 12.9% | 9.3% |
Similar Demographics by In Labor Force | Age 20-24
Demographics Similar to Cambodians by In Labor Force | Age 20-24
In terms of in labor force | age 20-24, the demographic groups most similar to Cambodians are Immigrants from South Eastern Asia (75.1%, a difference of 0.040%), Bolivian (75.2%, a difference of 0.050%), Afghan (75.2%, a difference of 0.050%), Immigrants from Romania (75.2%, a difference of 0.060%), and Costa Rican (75.2%, a difference of 0.060%).
| Demographics | Rating | Rank | In Labor Force | Age 20-24 |
| South American Indians | 69.0 /100 | #159 | Good 75.3% |
| Japanese | 68.7 /100 | #160 | Good 75.3% |
| New Zealanders | 65.4 /100 | #161 | Good 75.2% |
| Immigrants | Romania | 64.6 /100 | #162 | Good 75.2% |
| Costa Ricans | 64.2 /100 | #163 | Good 75.2% |
| Bolivians | 64.0 /100 | #164 | Good 75.2% |
| Afghans | 63.5 /100 | #165 | Good 75.2% |
| Cambodians | 60.5 /100 | #166 | Good 75.2% |
| Immigrants | South Eastern Asia | 57.5 /100 | #167 | Average 75.1% |
| Immigrants | Western Africa | 56.7 /100 | #168 | Average 75.1% |
| Immigrants | Philippines | 55.8 /100 | #169 | Average 75.1% |
| Mexicans | 52.1 /100 | #170 | Average 75.1% |
| Cajuns | 51.1 /100 | #171 | Average 75.1% |
| Yakama | 50.8 /100 | #172 | Average 75.1% |
| Immigrants | Croatia | 50.2 /100 | #173 | Average 75.1% |
Demographics Similar to Immigrants from Belize by In Labor Force | Age 20-24
In terms of in labor force | age 20-24, the demographic groups most similar to Immigrants from Belize are Immigrants from Argentina (72.8%, a difference of 0.030%), Pueblo (72.9%, a difference of 0.060%), Okinawan (72.7%, a difference of 0.14%), Jamaican (72.7%, a difference of 0.14%), and Immigrants from Nicaragua (72.9%, a difference of 0.15%).
| Demographics | Rating | Rank | In Labor Force | Age 20-24 |
| Immigrants | Lebanon | 0.1 /100 | #286 | Tragic 73.1% |
| Immigrants | Korea | 0.1 /100 | #287 | Tragic 73.1% |
| Argentineans | 0.1 /100 | #288 | Tragic 73.1% |
| U.S. Virgin Islanders | 0.1 /100 | #289 | Tragic 73.0% |
| Immigrants | Belarus | 0.1 /100 | #290 | Tragic 73.0% |
| Immigrants | Nicaragua | 0.0 /100 | #291 | Tragic 72.9% |
| Pueblo | 0.0 /100 | #292 | Tragic 72.9% |
| Immigrants | Belize | 0.0 /100 | #293 | Tragic 72.8% |
| Immigrants | Argentina | 0.0 /100 | #294 | Tragic 72.8% |
| Okinawans | 0.0 /100 | #295 | Tragic 72.7% |
| Jamaicans | 0.0 /100 | #296 | Tragic 72.7% |
| Central American Indians | 0.0 /100 | #297 | Tragic 72.7% |
| Israelis | 0.0 /100 | #298 | Tragic 72.6% |
| Iranians | 0.0 /100 | #299 | Tragic 72.6% |
| Armenians | 0.0 /100 | #300 | Tragic 72.5% |