Cambodian vs Nonimmigrants In Labor Force | Age 20-24
COMPARE
Cambodian
Nonimmigrants
In Labor Force | Age 20-24
In Labor Force | Age 20-24 Comparison
Cambodians
Nonimmigrants
75.2%
IN LABOR FORCE | AGE 20-24
60.5/ 100
METRIC RATING
166th/ 347
METRIC RANK
76.2%
IN LABOR FORCE | AGE 20-24
98.5/ 100
METRIC RATING
96th/ 347
METRIC RANK
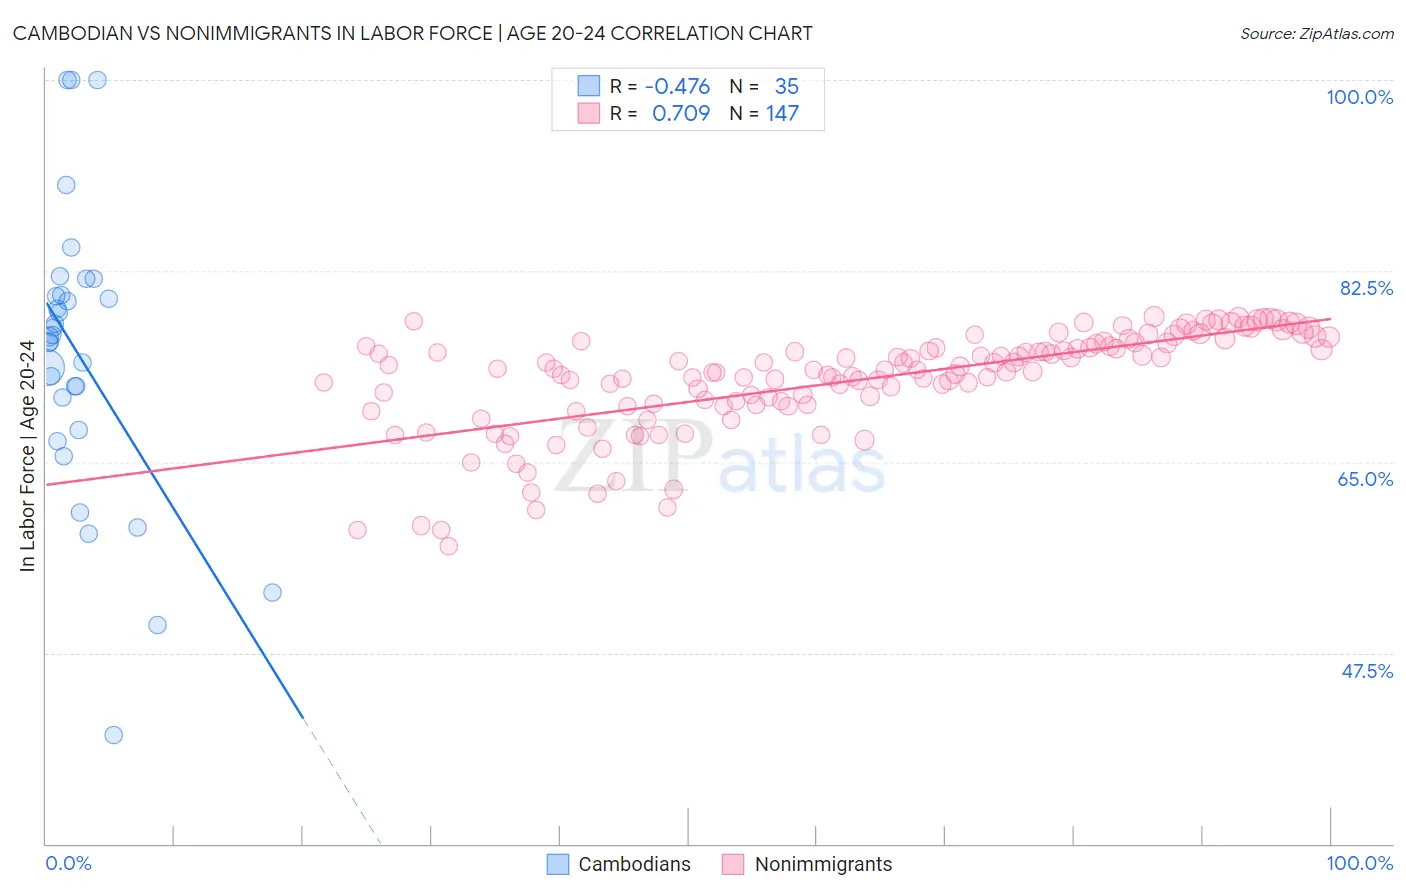
Cambodian vs Nonimmigrants In Labor Force | Age 20-24 Correlation Chart
The statistical analysis conducted on geographies consisting of 102,513,868 people shows a moderate negative correlation between the proportion of Cambodians and labor force participation rate among population between the ages 20 and 24 in the United States with a correlation coefficient (R) of -0.476 and weighted average of 75.2%. Similarly, the statistical analysis conducted on geographies consisting of 582,321,268 people shows a strong positive correlation between the proportion of Nonimmigrants and labor force participation rate among population between the ages 20 and 24 in the United States with a correlation coefficient (R) of 0.709 and weighted average of 76.2%, a difference of 1.4%.
In Labor Force | Age 20-24 Correlation Summary
| Measurement | Cambodian | Nonimmigrants |
| Minimum | 40.0% | 57.2% |
| Maximum | 100.0% | 78.3% |
| Range | 60.0% | 21.1% |
| Mean | 74.7% | 72.5% |
| Median | 76.5% | 73.4% |
| Interquartile 25% (IQ1) | 68.0% | 70.2% |
| Interquartile 75% (IQ3) | 80.3% | 75.8% |
| Interquartile Range (IQR) | 12.4% | 5.6% |
| Standard Deviation (Sample) | 13.1% | 4.7% |
| Standard Deviation (Population) | 12.9% | 4.6% |
Similar Demographics by In Labor Force | Age 20-24
Demographics Similar to Cambodians by In Labor Force | Age 20-24
In terms of in labor force | age 20-24, the demographic groups most similar to Cambodians are Immigrants from South Eastern Asia (75.1%, a difference of 0.040%), Bolivian (75.2%, a difference of 0.050%), Afghan (75.2%, a difference of 0.050%), Immigrants from Romania (75.2%, a difference of 0.060%), and Costa Rican (75.2%, a difference of 0.060%).
| Demographics | Rating | Rank | In Labor Force | Age 20-24 |
| South American Indians | 69.0 /100 | #159 | Good 75.3% |
| Japanese | 68.7 /100 | #160 | Good 75.3% |
| New Zealanders | 65.4 /100 | #161 | Good 75.2% |
| Immigrants | Romania | 64.6 /100 | #162 | Good 75.2% |
| Costa Ricans | 64.2 /100 | #163 | Good 75.2% |
| Bolivians | 64.0 /100 | #164 | Good 75.2% |
| Afghans | 63.5 /100 | #165 | Good 75.2% |
| Cambodians | 60.5 /100 | #166 | Good 75.2% |
| Immigrants | South Eastern Asia | 57.5 /100 | #167 | Average 75.1% |
| Immigrants | Western Africa | 56.7 /100 | #168 | Average 75.1% |
| Immigrants | Philippines | 55.8 /100 | #169 | Average 75.1% |
| Mexicans | 52.1 /100 | #170 | Average 75.1% |
| Cajuns | 51.1 /100 | #171 | Average 75.1% |
| Yakama | 50.8 /100 | #172 | Average 75.1% |
| Immigrants | Croatia | 50.2 /100 | #173 | Average 75.1% |
Demographics Similar to Nonimmigrants by In Labor Force | Age 20-24
In terms of in labor force | age 20-24, the demographic groups most similar to Nonimmigrants are Potawatomi (76.2%, a difference of 0.010%), Immigrants from Germany (76.2%, a difference of 0.010%), Immigrants from Lithuania (76.1%, a difference of 0.10%), Immigrants from Oceania (76.1%, a difference of 0.10%), and Hungarian (76.3%, a difference of 0.11%).
| Demographics | Rating | Rank | In Labor Force | Age 20-24 |
| Bulgarians | 99.2 /100 | #89 | Exceptional 76.4% |
| Immigrants | Burma/Myanmar | 99.1 /100 | #90 | Exceptional 76.3% |
| Sierra Leoneans | 99.0 /100 | #91 | Exceptional 76.3% |
| Maltese | 98.9 /100 | #92 | Exceptional 76.3% |
| Hungarians | 98.9 /100 | #93 | Exceptional 76.3% |
| Potawatomi | 98.5 /100 | #94 | Exceptional 76.2% |
| Immigrants | Germany | 98.5 /100 | #95 | Exceptional 76.2% |
| Immigrants | Nonimmigrants | 98.5 /100 | #96 | Exceptional 76.2% |
| Immigrants | Lithuania | 98.0 /100 | #97 | Exceptional 76.1% |
| Immigrants | Oceania | 98.0 /100 | #98 | Exceptional 76.1% |
| Americans | 97.8 /100 | #99 | Exceptional 76.1% |
| Shoshone | 97.8 /100 | #100 | Exceptional 76.1% |
| Immigrants | Poland | 97.7 /100 | #101 | Exceptional 76.1% |
| Latvians | 97.6 /100 | #102 | Exceptional 76.1% |
| Immigrants | North Macedonia | 97.5 /100 | #103 | Exceptional 76.1% |