Cambodian vs Immigrants from North Macedonia In Labor Force | Age > 16
COMPARE
Cambodian
Immigrants from North Macedonia
In Labor Force | Age > 16
In Labor Force | Age > 16 Comparison
Cambodians
Immigrants from North Macedonia
67.4%
IN LABOR FORCE | AGE > 16
100.0/ 100
METRIC RATING
23rd/ 347
METRIC RANK
65.6%
IN LABOR FORCE | AGE > 16
94.1/ 100
METRIC RATING
132nd/ 347
METRIC RANK
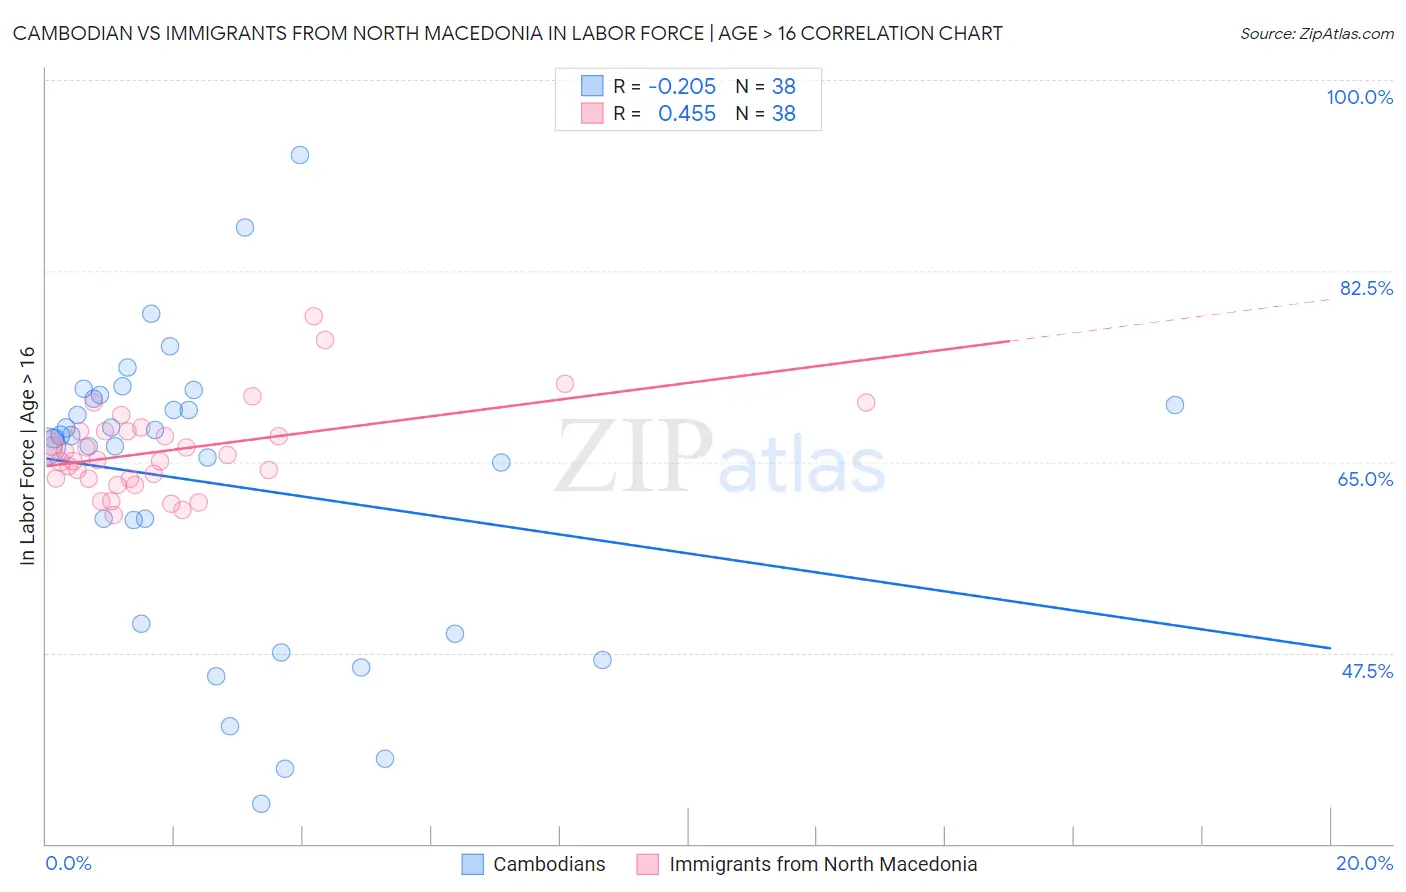
Cambodian vs Immigrants from North Macedonia In Labor Force | Age > 16 Correlation Chart
The statistical analysis conducted on geographies consisting of 102,521,417 people shows a weak negative correlation between the proportion of Cambodians and labor force participation rate among population ages 16 and over in the United States with a correlation coefficient (R) of -0.205 and weighted average of 67.4%. Similarly, the statistical analysis conducted on geographies consisting of 74,317,186 people shows a moderate positive correlation between the proportion of Immigrants from North Macedonia and labor force participation rate among population ages 16 and over in the United States with a correlation coefficient (R) of 0.455 and weighted average of 65.6%, a difference of 2.7%.
In Labor Force | Age > 16 Correlation Summary
| Measurement | Cambodian | Immigrants from North Macedonia |
| Minimum | 33.7% | 60.2% |
| Maximum | 93.1% | 78.4% |
| Range | 59.4% | 18.2% |
| Mean | 63.0% | 66.1% |
| Median | 67.3% | 65.4% |
| Interquartile 25% (IQ1) | 50.2% | 63.5% |
| Interquartile 75% (IQ3) | 70.8% | 67.8% |
| Interquartile Range (IQR) | 20.6% | 4.3% |
| Standard Deviation (Sample) | 13.6% | 4.0% |
| Standard Deviation (Population) | 13.4% | 4.0% |
Similar Demographics by In Labor Force | Age > 16
Demographics Similar to Cambodians by In Labor Force | Age > 16
In terms of in labor force | age > 16, the demographic groups most similar to Cambodians are Ugandan (67.4%, a difference of 0.060%), Immigrants from Africa (67.4%, a difference of 0.090%), Immigrants from Uganda (67.5%, a difference of 0.12%), Immigrants from Cabo Verde (67.3%, a difference of 0.12%), and Tongan (67.5%, a difference of 0.18%).
| Demographics | Rating | Rank | In Labor Force | Age > 16 |
| Immigrants | Sudan | 100.0 /100 | #16 | Exceptional 67.7% |
| Immigrants | India | 100.0 /100 | #17 | Exceptional 67.6% |
| Immigrants | Liberia | 100.0 /100 | #18 | Exceptional 67.6% |
| Kenyans | 100.0 /100 | #19 | Exceptional 67.6% |
| Immigrants | Kenya | 100.0 /100 | #20 | Exceptional 67.6% |
| Tongans | 100.0 /100 | #21 | Exceptional 67.5% |
| Immigrants | Uganda | 100.0 /100 | #22 | Exceptional 67.5% |
| Cambodians | 100.0 /100 | #23 | Exceptional 67.4% |
| Ugandans | 100.0 /100 | #24 | Exceptional 67.4% |
| Immigrants | Africa | 100.0 /100 | #25 | Exceptional 67.4% |
| Immigrants | Cabo Verde | 100.0 /100 | #26 | Exceptional 67.3% |
| Zimbabweans | 100.0 /100 | #27 | Exceptional 67.3% |
| Immigrants | Morocco | 100.0 /100 | #28 | Exceptional 67.2% |
| Thais | 100.0 /100 | #29 | Exceptional 67.2% |
| Immigrants | Zaire | 100.0 /100 | #30 | Exceptional 67.2% |
Demographics Similar to Immigrants from North Macedonia by In Labor Force | Age > 16
In terms of in labor force | age > 16, the demographic groups most similar to Immigrants from North Macedonia are Immigrants from Guatemala (65.6%, a difference of 0.010%), Icelander (65.6%, a difference of 0.010%), Immigrants from Philippines (65.6%, a difference of 0.020%), Ecuadorian (65.6%, a difference of 0.030%), and Immigrants from Lithuania (65.6%, a difference of 0.030%).
| Demographics | Rating | Rank | In Labor Force | Age > 16 |
| Norwegians | 95.3 /100 | #125 | Exceptional 65.7% |
| Koreans | 95.3 /100 | #126 | Exceptional 65.7% |
| Immigrants | Eastern Asia | 94.9 /100 | #127 | Exceptional 65.7% |
| Ecuadorians | 94.7 /100 | #128 | Exceptional 65.6% |
| Immigrants | Philippines | 94.5 /100 | #129 | Exceptional 65.6% |
| Immigrants | Guatemala | 94.4 /100 | #130 | Exceptional 65.6% |
| Icelanders | 94.3 /100 | #131 | Exceptional 65.6% |
| Immigrants | North Macedonia | 94.1 /100 | #132 | Exceptional 65.6% |
| Immigrants | Lithuania | 93.5 /100 | #133 | Exceptional 65.6% |
| Costa Ricans | 93.2 /100 | #134 | Exceptional 65.6% |
| Guatemalans | 92.5 /100 | #135 | Exceptional 65.6% |
| Immigrants | Argentina | 92.4 /100 | #136 | Exceptional 65.6% |
| Guamanians/Chamorros | 92.4 /100 | #137 | Exceptional 65.6% |
| Immigrants | West Indies | 92.0 /100 | #138 | Exceptional 65.6% |
| Immigrants | Taiwan | 90.8 /100 | #139 | Exceptional 65.5% |