British West Indian vs Trinidadian and Tobagonian In Labor Force | Age 20-24
COMPARE
British West Indian
Trinidadian and Tobagonian
In Labor Force | Age 20-24
In Labor Force | Age 20-24 Comparison
British West Indians
Trinidadians and Tobagonians
70.0%
IN LABOR FORCE | AGE 20-24
0.0/ 100
METRIC RATING
334th/ 347
METRIC RANK
71.5%
IN LABOR FORCE | AGE 20-24
0.0/ 100
METRIC RATING
320th/ 347
METRIC RANK
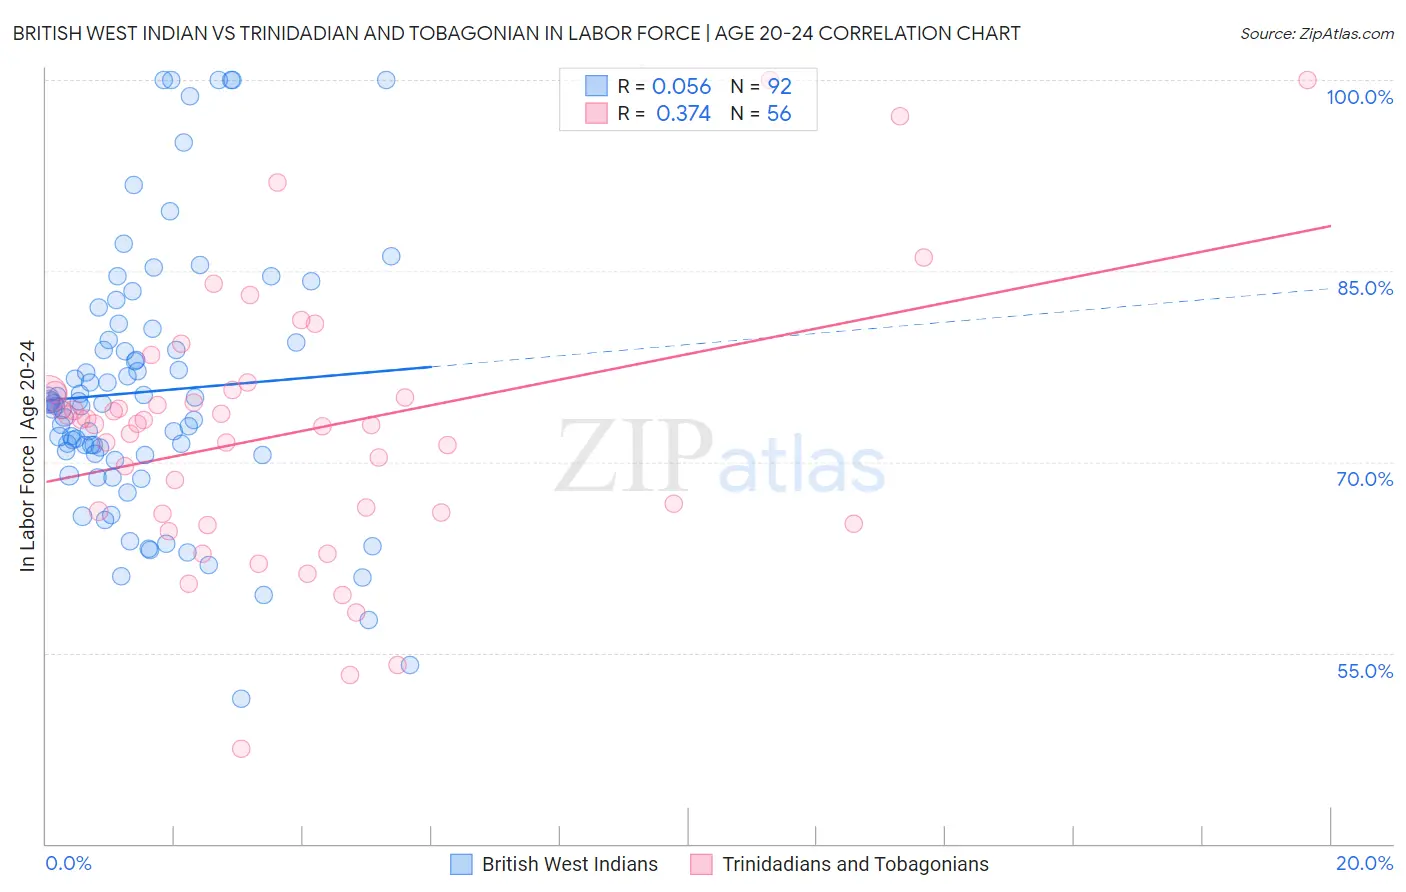
British West Indian vs Trinidadian and Tobagonian In Labor Force | Age 20-24 Correlation Chart
The statistical analysis conducted on geographies consisting of 152,699,187 people shows a slight positive correlation between the proportion of British West Indians and labor force participation rate among population between the ages 20 and 24 in the United States with a correlation coefficient (R) of 0.056 and weighted average of 70.0%. Similarly, the statistical analysis conducted on geographies consisting of 219,866,832 people shows a mild positive correlation between the proportion of Trinidadians and Tobagonians and labor force participation rate among population between the ages 20 and 24 in the United States with a correlation coefficient (R) of 0.374 and weighted average of 71.5%, a difference of 2.2%.
In Labor Force | Age 20-24 Correlation Summary
| Measurement | British West Indian | Trinidadian and Tobagonian |
| Minimum | 51.4% | 47.5% |
| Maximum | 100.0% | 100.0% |
| Range | 48.6% | 52.5% |
| Mean | 75.5% | 72.3% |
| Median | 74.5% | 73.0% |
| Interquartile 25% (IQ1) | 70.5% | 66.0% |
| Interquartile 75% (IQ3) | 79.5% | 75.4% |
| Interquartile Range (IQR) | 9.0% | 9.4% |
| Standard Deviation (Sample) | 10.5% | 10.4% |
| Standard Deviation (Population) | 10.4% | 10.3% |
Demographics Similar to British West Indians and Trinidadians and Tobagonians by In Labor Force | Age 20-24
In terms of in labor force | age 20-24, the demographic groups most similar to British West Indians are Immigrants from Barbados (69.7%, a difference of 0.35%), Yuman (70.3%, a difference of 0.41%), Immigrants from Uzbekistan (70.4%, a difference of 0.63%), Immigrants from Bangladesh (70.6%, a difference of 0.94%), and Vietnamese (70.6%, a difference of 0.96%). Similarly, the demographic groups most similar to Trinidadians and Tobagonians are Immigrants from Taiwan (71.5%, a difference of 0.050%), Immigrants from Israel (71.6%, a difference of 0.080%), Immigrants from Hong Kong (71.6%, a difference of 0.11%), Filipino (71.4%, a difference of 0.18%), and Immigrants from Armenia (71.7%, a difference of 0.20%).
| Demographics | Rating | Rank | In Labor Force | Age 20-24 |
| Immigrants | Armenia | 0.0 /100 | #317 | Tragic 71.7% |
| Immigrants | Hong Kong | 0.0 /100 | #318 | Tragic 71.6% |
| Immigrants | Israel | 0.0 /100 | #319 | Tragic 71.6% |
| Trinidadians and Tobagonians | 0.0 /100 | #320 | Tragic 71.5% |
| Immigrants | Taiwan | 0.0 /100 | #321 | Tragic 71.5% |
| Filipinos | 0.0 /100 | #322 | Tragic 71.4% |
| West Indians | 0.0 /100 | #323 | Tragic 71.3% |
| Immigrants | Dominican Republic | 0.0 /100 | #324 | Tragic 71.2% |
| Barbadians | 0.0 /100 | #325 | Tragic 71.1% |
| Dominicans | 0.0 /100 | #326 | Tragic 71.1% |
| Immigrants | Trinidad and Tobago | 0.0 /100 | #327 | Tragic 71.1% |
| Immigrants | China | 0.0 /100 | #328 | Tragic 71.1% |
| Yup'ik | 0.0 /100 | #329 | Tragic 70.9% |
| Vietnamese | 0.0 /100 | #330 | Tragic 70.6% |
| Immigrants | Bangladesh | 0.0 /100 | #331 | Tragic 70.6% |
| Immigrants | Uzbekistan | 0.0 /100 | #332 | Tragic 70.4% |
| Yuman | 0.0 /100 | #333 | Tragic 70.3% |
| British West Indians | 0.0 /100 | #334 | Tragic 70.0% |
| Immigrants | Barbados | 0.0 /100 | #335 | Tragic 69.7% |
| Immigrants | Guyana | 0.0 /100 | #336 | Tragic 69.3% |
| Guyanese | 0.0 /100 | #337 | Tragic 69.2% |