British West Indian vs Scottish In Labor Force | Age 20-24
COMPARE
British West Indian
Scottish
In Labor Force | Age 20-24
In Labor Force | Age 20-24 Comparison
British West Indians
Scottish
70.0%
IN LABOR FORCE | AGE 20-24
0.0/ 100
METRIC RATING
334th/ 347
METRIC RANK
77.4%
IN LABOR FORCE | AGE 20-24
100.0/ 100
METRIC RATING
40th/ 347
METRIC RANK
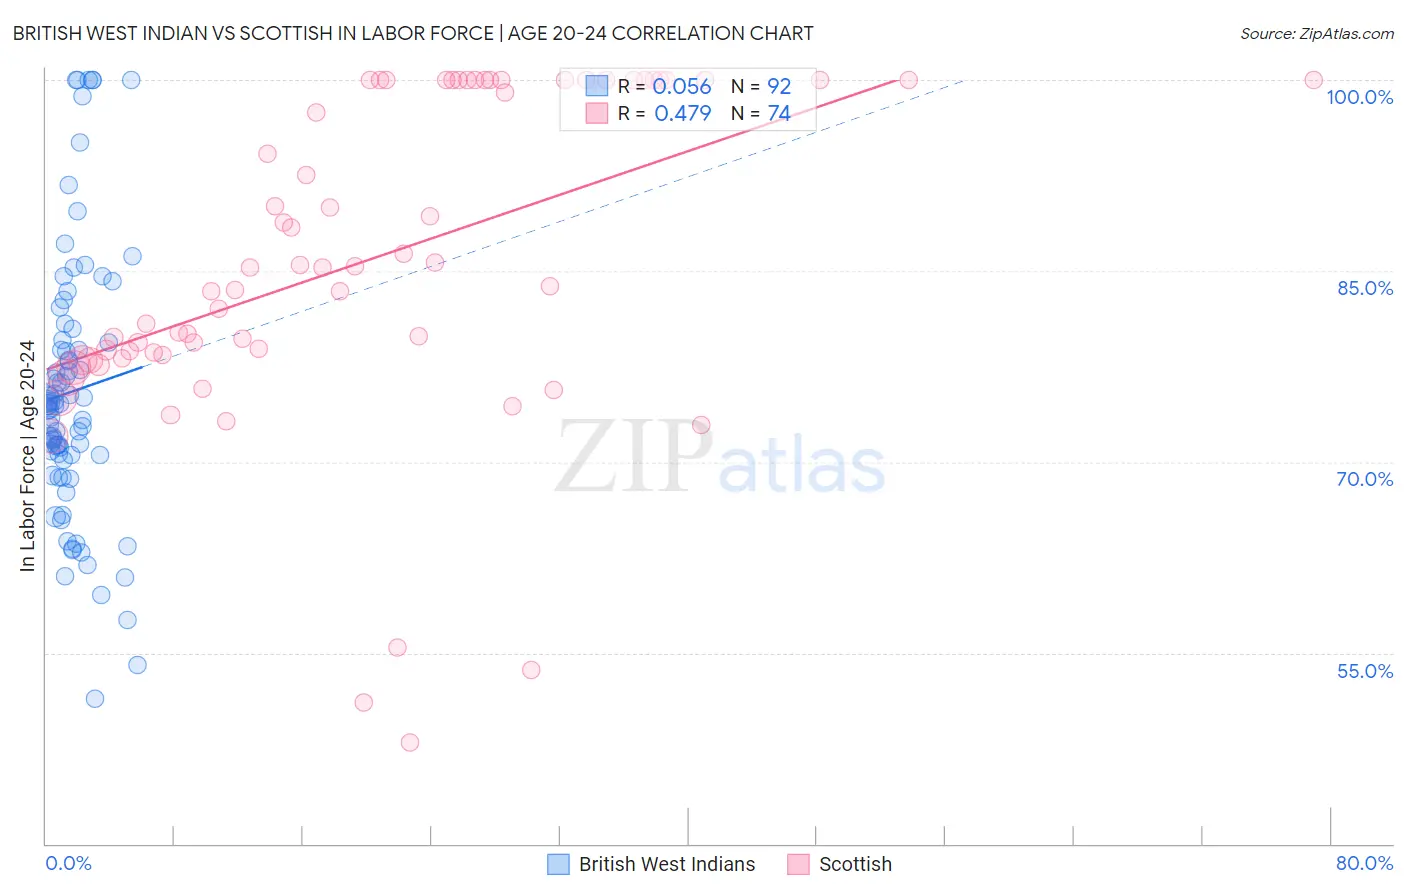
British West Indian vs Scottish In Labor Force | Age 20-24 Correlation Chart
The statistical analysis conducted on geographies consisting of 152,699,187 people shows a slight positive correlation between the proportion of British West Indians and labor force participation rate among population between the ages 20 and 24 in the United States with a correlation coefficient (R) of 0.056 and weighted average of 70.0%. Similarly, the statistical analysis conducted on geographies consisting of 565,643,510 people shows a moderate positive correlation between the proportion of Scottish and labor force participation rate among population between the ages 20 and 24 in the United States with a correlation coefficient (R) of 0.479 and weighted average of 77.4%, a difference of 10.6%.
In Labor Force | Age 20-24 Correlation Summary
| Measurement | British West Indian | Scottish |
| Minimum | 51.4% | 47.9% |
| Maximum | 100.0% | 100.0% |
| Range | 48.6% | 52.1% |
| Mean | 75.5% | 85.9% |
| Median | 74.5% | 85.3% |
| Interquartile 25% (IQ1) | 70.5% | 78.4% |
| Interquartile 75% (IQ3) | 79.5% | 100.0% |
| Interquartile Range (IQR) | 9.0% | 21.6% |
| Standard Deviation (Sample) | 10.5% | 12.7% |
| Standard Deviation (Population) | 10.4% | 12.6% |
Similar Demographics by In Labor Force | Age 20-24
Demographics Similar to British West Indians by In Labor Force | Age 20-24
In terms of in labor force | age 20-24, the demographic groups most similar to British West Indians are Immigrants from Barbados (69.7%, a difference of 0.35%), Yuman (70.3%, a difference of 0.41%), Immigrants from Uzbekistan (70.4%, a difference of 0.63%), Immigrants from Bangladesh (70.6%, a difference of 0.94%), and Vietnamese (70.6%, a difference of 0.96%).
| Demographics | Rating | Rank | In Labor Force | Age 20-24 |
| Immigrants | Trinidad and Tobago | 0.0 /100 | #327 | Tragic 71.1% |
| Immigrants | China | 0.0 /100 | #328 | Tragic 71.1% |
| Yup'ik | 0.0 /100 | #329 | Tragic 70.9% |
| Vietnamese | 0.0 /100 | #330 | Tragic 70.6% |
| Immigrants | Bangladesh | 0.0 /100 | #331 | Tragic 70.6% |
| Immigrants | Uzbekistan | 0.0 /100 | #332 | Tragic 70.4% |
| Yuman | 0.0 /100 | #333 | Tragic 70.3% |
| British West Indians | 0.0 /100 | #334 | Tragic 70.0% |
| Immigrants | Barbados | 0.0 /100 | #335 | Tragic 69.7% |
| Immigrants | Guyana | 0.0 /100 | #336 | Tragic 69.3% |
| Guyanese | 0.0 /100 | #337 | Tragic 69.2% |
| Pima | 0.0 /100 | #338 | Tragic 69.0% |
| Immigrants | Yemen | 0.0 /100 | #339 | Tragic 68.9% |
| Menominee | 0.0 /100 | #340 | Tragic 68.7% |
| Tohono O'odham | 0.0 /100 | #341 | Tragic 68.6% |
Demographics Similar to Scottish by In Labor Force | Age 20-24
In terms of in labor force | age 20-24, the demographic groups most similar to Scottish are Immigrants from Congo (77.4%, a difference of 0.010%), Irish (77.4%, a difference of 0.030%), French (77.4%, a difference of 0.030%), Immigrants from Laos (77.4%, a difference of 0.030%), and Fijian (77.4%, a difference of 0.050%).
| Demographics | Rating | Rank | In Labor Force | Age 20-24 |
| Immigrants | Ethiopia | 100.0 /100 | #33 | Exceptional 77.5% |
| German Russians | 100.0 /100 | #34 | Exceptional 77.5% |
| Immigrants | Eastern Africa | 100.0 /100 | #35 | Exceptional 77.5% |
| Welsh | 100.0 /100 | #36 | Exceptional 77.5% |
| Czechoslovakians | 100.0 /100 | #37 | Exceptional 77.5% |
| Marshallese | 100.0 /100 | #38 | Exceptional 77.4% |
| Irish | 100.0 /100 | #39 | Exceptional 77.4% |
| Scottish | 100.0 /100 | #40 | Exceptional 77.4% |
| Immigrants | Congo | 100.0 /100 | #41 | Exceptional 77.4% |
| French | 100.0 /100 | #42 | Exceptional 77.4% |
| Immigrants | Laos | 100.0 /100 | #43 | Exceptional 77.4% |
| Fijians | 100.0 /100 | #44 | Exceptional 77.4% |
| Native Hawaiians | 100.0 /100 | #45 | Exceptional 77.4% |
| Samoans | 100.0 /100 | #46 | Exceptional 77.4% |
| Ethiopians | 100.0 /100 | #47 | Exceptional 77.3% |