British West Indian vs Immigrants from North America In Labor Force | Age 20-24
COMPARE
British West Indian
Immigrants from North America
In Labor Force | Age 20-24
In Labor Force | Age 20-24 Comparison
British West Indians
Immigrants from North America
70.0%
IN LABOR FORCE | AGE 20-24
0.0/ 100
METRIC RATING
334th/ 347
METRIC RANK
75.9%
IN LABOR FORCE | AGE 20-24
95.0/ 100
METRIC RATING
116th/ 347
METRIC RANK
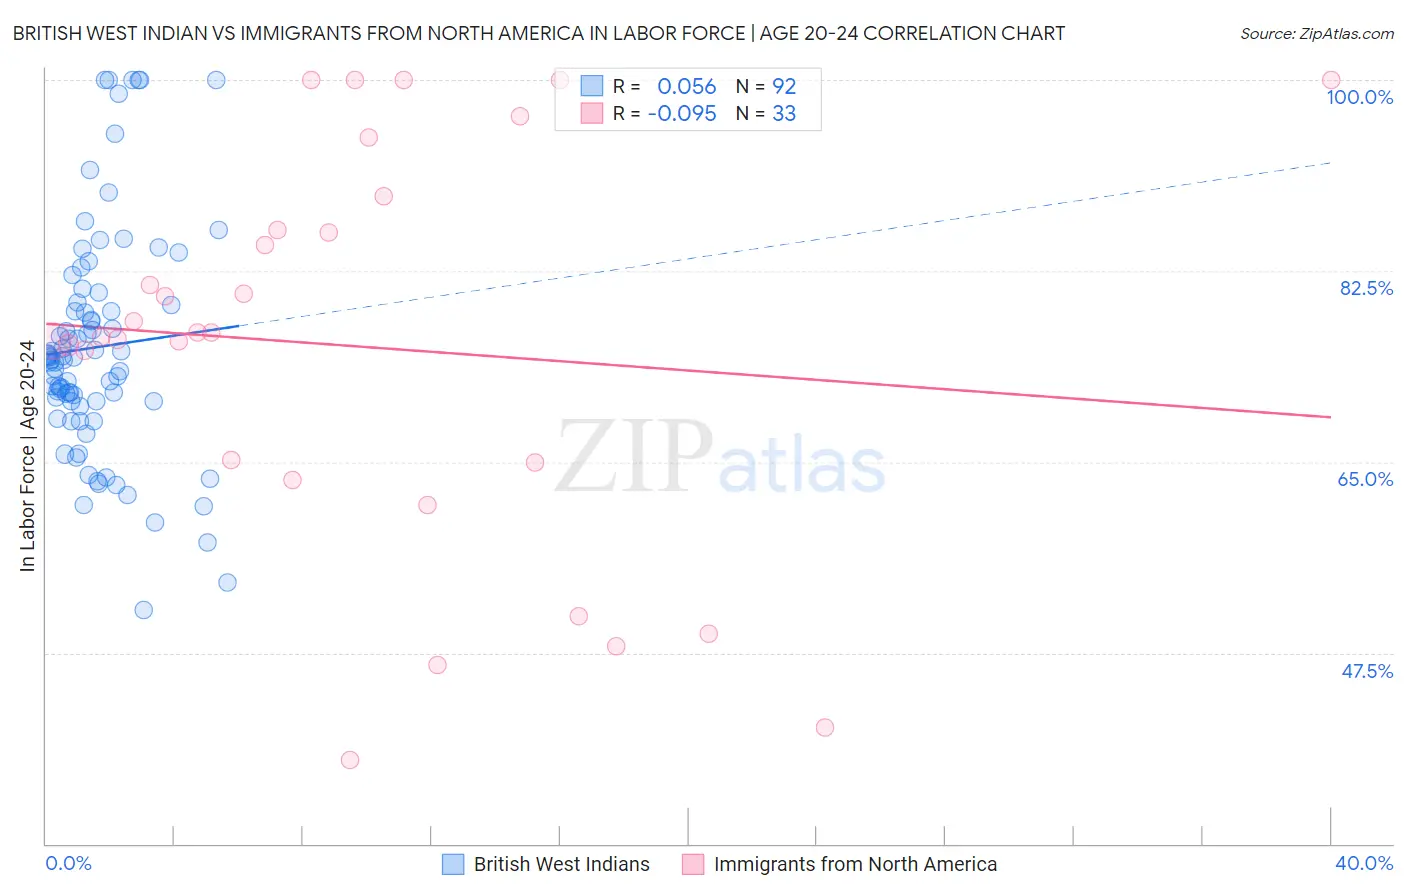
British West Indian vs Immigrants from North America In Labor Force | Age 20-24 Correlation Chart
The statistical analysis conducted on geographies consisting of 152,699,187 people shows a slight positive correlation between the proportion of British West Indians and labor force participation rate among population between the ages 20 and 24 in the United States with a correlation coefficient (R) of 0.056 and weighted average of 70.0%. Similarly, the statistical analysis conducted on geographies consisting of 462,031,156 people shows a slight negative correlation between the proportion of Immigrants from North America and labor force participation rate among population between the ages 20 and 24 in the United States with a correlation coefficient (R) of -0.095 and weighted average of 75.9%, a difference of 8.4%.
In Labor Force | Age 20-24 Correlation Summary
| Measurement | British West Indian | Immigrants from North America |
| Minimum | 51.4% | 37.7% |
| Maximum | 100.0% | 100.0% |
| Range | 48.6% | 62.3% |
| Mean | 75.5% | 75.6% |
| Median | 74.5% | 76.8% |
| Interquartile 25% (IQ1) | 70.5% | 64.1% |
| Interquartile 75% (IQ3) | 79.5% | 87.8% |
| Interquartile Range (IQR) | 9.0% | 23.6% |
| Standard Deviation (Sample) | 10.5% | 18.1% |
| Standard Deviation (Population) | 10.4% | 17.9% |
Similar Demographics by In Labor Force | Age 20-24
Demographics Similar to British West Indians by In Labor Force | Age 20-24
In terms of in labor force | age 20-24, the demographic groups most similar to British West Indians are Immigrants from Barbados (69.7%, a difference of 0.35%), Yuman (70.3%, a difference of 0.41%), Immigrants from Uzbekistan (70.4%, a difference of 0.63%), Immigrants from Bangladesh (70.6%, a difference of 0.94%), and Vietnamese (70.6%, a difference of 0.96%).
| Demographics | Rating | Rank | In Labor Force | Age 20-24 |
| Immigrants | Trinidad and Tobago | 0.0 /100 | #327 | Tragic 71.1% |
| Immigrants | China | 0.0 /100 | #328 | Tragic 71.1% |
| Yup'ik | 0.0 /100 | #329 | Tragic 70.9% |
| Vietnamese | 0.0 /100 | #330 | Tragic 70.6% |
| Immigrants | Bangladesh | 0.0 /100 | #331 | Tragic 70.6% |
| Immigrants | Uzbekistan | 0.0 /100 | #332 | Tragic 70.4% |
| Yuman | 0.0 /100 | #333 | Tragic 70.3% |
| British West Indians | 0.0 /100 | #334 | Tragic 70.0% |
| Immigrants | Barbados | 0.0 /100 | #335 | Tragic 69.7% |
| Immigrants | Guyana | 0.0 /100 | #336 | Tragic 69.3% |
| Guyanese | 0.0 /100 | #337 | Tragic 69.2% |
| Pima | 0.0 /100 | #338 | Tragic 69.0% |
| Immigrants | Yemen | 0.0 /100 | #339 | Tragic 68.9% |
| Menominee | 0.0 /100 | #340 | Tragic 68.7% |
| Tohono O'odham | 0.0 /100 | #341 | Tragic 68.6% |
Demographics Similar to Immigrants from North America by In Labor Force | Age 20-24
In terms of in labor force | age 20-24, the demographic groups most similar to Immigrants from North America are Immigrants from Zimbabwe (75.9%, a difference of 0.010%), Alaska Native (75.9%, a difference of 0.010%), Assyrian/Chaldean/Syriac (75.9%, a difference of 0.010%), Spanish American (75.8%, a difference of 0.010%), and Immigrants from Portugal (75.8%, a difference of 0.010%).
| Demographics | Rating | Rank | In Labor Force | Age 20-24 |
| Cherokee | 95.8 /100 | #109 | Exceptional 75.9% |
| Immigrants | Morocco | 95.8 /100 | #110 | Exceptional 75.9% |
| Ukrainians | 95.7 /100 | #111 | Exceptional 75.9% |
| Immigrants | Canada | 95.6 /100 | #112 | Exceptional 75.9% |
| Immigrants | Netherlands | 95.3 /100 | #113 | Exceptional 75.9% |
| Immigrants | Zimbabwe | 95.1 /100 | #114 | Exceptional 75.9% |
| Alaska Natives | 95.1 /100 | #115 | Exceptional 75.9% |
| Immigrants | North America | 95.0 /100 | #116 | Exceptional 75.9% |
| Assyrians/Chaldeans/Syriacs | 94.9 /100 | #117 | Exceptional 75.9% |
| Spanish Americans | 94.8 /100 | #118 | Exceptional 75.8% |
| Immigrants | Portugal | 94.8 /100 | #119 | Exceptional 75.8% |
| Immigrants | Africa | 94.6 /100 | #120 | Exceptional 75.8% |
| Immigrants | Serbia | 94.3 /100 | #121 | Exceptional 75.8% |
| Pakistanis | 94.1 /100 | #122 | Exceptional 75.8% |
| Immigrants | Bulgaria | 94.1 /100 | #123 | Exceptional 75.8% |