American vs Trinidadian and Tobagonian In Labor Force | Age 20-24
COMPARE
American
Trinidadian and Tobagonian
In Labor Force | Age 20-24
In Labor Force | Age 20-24 Comparison
Americans
Trinidadians and Tobagonians
76.1%
IN LABOR FORCE | AGE 20-24
97.8/ 100
METRIC RATING
99th/ 347
METRIC RANK
71.5%
IN LABOR FORCE | AGE 20-24
0.0/ 100
METRIC RATING
320th/ 347
METRIC RANK
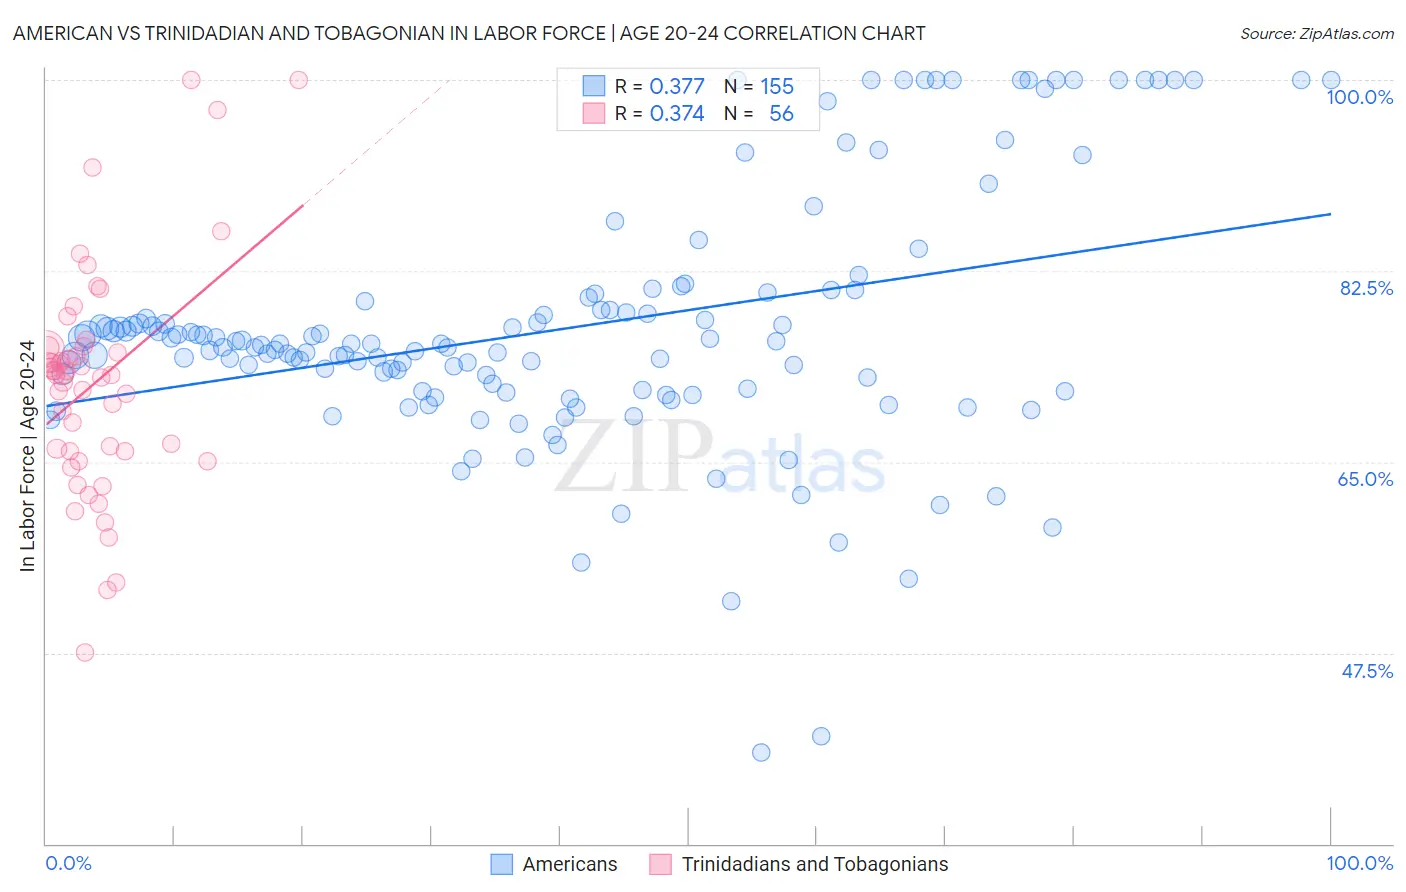
American vs Trinidadian and Tobagonian In Labor Force | Age 20-24 Correlation Chart
The statistical analysis conducted on geographies consisting of 579,768,276 people shows a mild positive correlation between the proportion of Americans and labor force participation rate among population between the ages 20 and 24 in the United States with a correlation coefficient (R) of 0.377 and weighted average of 76.1%. Similarly, the statistical analysis conducted on geographies consisting of 219,866,832 people shows a mild positive correlation between the proportion of Trinidadians and Tobagonians and labor force participation rate among population between the ages 20 and 24 in the United States with a correlation coefficient (R) of 0.374 and weighted average of 71.5%, a difference of 6.4%.
In Labor Force | Age 20-24 Correlation Summary
| Measurement | American | Trinidadian and Tobagonian |
| Minimum | 38.4% | 47.5% |
| Maximum | 100.0% | 100.0% |
| Range | 61.6% | 52.5% |
| Mean | 77.2% | 72.3% |
| Median | 75.7% | 73.0% |
| Interquartile 25% (IQ1) | 71.5% | 66.0% |
| Interquartile 75% (IQ3) | 79.7% | 75.4% |
| Interquartile Range (IQR) | 8.3% | 9.4% |
| Standard Deviation (Sample) | 11.5% | 10.4% |
| Standard Deviation (Population) | 11.5% | 10.3% |
Similar Demographics by In Labor Force | Age 20-24
Demographics Similar to Americans by In Labor Force | Age 20-24
In terms of in labor force | age 20-24, the demographic groups most similar to Americans are Shoshone (76.1%, a difference of 0.0%), Immigrants from Poland (76.1%, a difference of 0.020%), Immigrants from Lithuania (76.1%, a difference of 0.030%), Immigrants from Oceania (76.1%, a difference of 0.030%), and Latvian (76.1%, a difference of 0.030%).
| Demographics | Rating | Rank | In Labor Force | Age 20-24 |
| Maltese | 98.9 /100 | #92 | Exceptional 76.3% |
| Hungarians | 98.9 /100 | #93 | Exceptional 76.3% |
| Potawatomi | 98.5 /100 | #94 | Exceptional 76.2% |
| Immigrants | Germany | 98.5 /100 | #95 | Exceptional 76.2% |
| Immigrants | Nonimmigrants | 98.5 /100 | #96 | Exceptional 76.2% |
| Immigrants | Lithuania | 98.0 /100 | #97 | Exceptional 76.1% |
| Immigrants | Oceania | 98.0 /100 | #98 | Exceptional 76.1% |
| Americans | 97.8 /100 | #99 | Exceptional 76.1% |
| Shoshone | 97.8 /100 | #100 | Exceptional 76.1% |
| Immigrants | Poland | 97.7 /100 | #101 | Exceptional 76.1% |
| Latvians | 97.6 /100 | #102 | Exceptional 76.1% |
| Immigrants | North Macedonia | 97.5 /100 | #103 | Exceptional 76.1% |
| Macedonians | 97.2 /100 | #104 | Exceptional 76.0% |
| Immigrants | Nepal | 97.2 /100 | #105 | Exceptional 76.0% |
| Immigrants | Uganda | 97.1 /100 | #106 | Exceptional 76.0% |
Demographics Similar to Trinidadians and Tobagonians by In Labor Force | Age 20-24
In terms of in labor force | age 20-24, the demographic groups most similar to Trinidadians and Tobagonians are Immigrants from Taiwan (71.5%, a difference of 0.050%), Immigrants from Israel (71.6%, a difference of 0.080%), Immigrants from Hong Kong (71.6%, a difference of 0.11%), Filipino (71.4%, a difference of 0.18%), and Immigrants from Armenia (71.7%, a difference of 0.20%).
| Demographics | Rating | Rank | In Labor Force | Age 20-24 |
| Immigrants | Dominica | 0.0 /100 | #313 | Tragic 71.9% |
| Indians (Asian) | 0.0 /100 | #314 | Tragic 71.9% |
| Immigrants | Iran | 0.0 /100 | #315 | Tragic 71.8% |
| Immigrants | Eastern Asia | 0.0 /100 | #316 | Tragic 71.8% |
| Immigrants | Armenia | 0.0 /100 | #317 | Tragic 71.7% |
| Immigrants | Hong Kong | 0.0 /100 | #318 | Tragic 71.6% |
| Immigrants | Israel | 0.0 /100 | #319 | Tragic 71.6% |
| Trinidadians and Tobagonians | 0.0 /100 | #320 | Tragic 71.5% |
| Immigrants | Taiwan | 0.0 /100 | #321 | Tragic 71.5% |
| Filipinos | 0.0 /100 | #322 | Tragic 71.4% |
| West Indians | 0.0 /100 | #323 | Tragic 71.3% |
| Immigrants | Dominican Republic | 0.0 /100 | #324 | Tragic 71.2% |
| Barbadians | 0.0 /100 | #325 | Tragic 71.1% |
| Dominicans | 0.0 /100 | #326 | Tragic 71.1% |
| Immigrants | Trinidad and Tobago | 0.0 /100 | #327 | Tragic 71.1% |