British West Indian vs Immigrants from Philippines In Labor Force | Age 20-24
COMPARE
British West Indian
Immigrants from Philippines
In Labor Force | Age 20-24
In Labor Force | Age 20-24 Comparison
British West Indians
Immigrants from Philippines
70.0%
IN LABOR FORCE | AGE 20-24
0.0/ 100
METRIC RATING
334th/ 347
METRIC RANK
75.1%
IN LABOR FORCE | AGE 20-24
55.8/ 100
METRIC RATING
169th/ 347
METRIC RANK
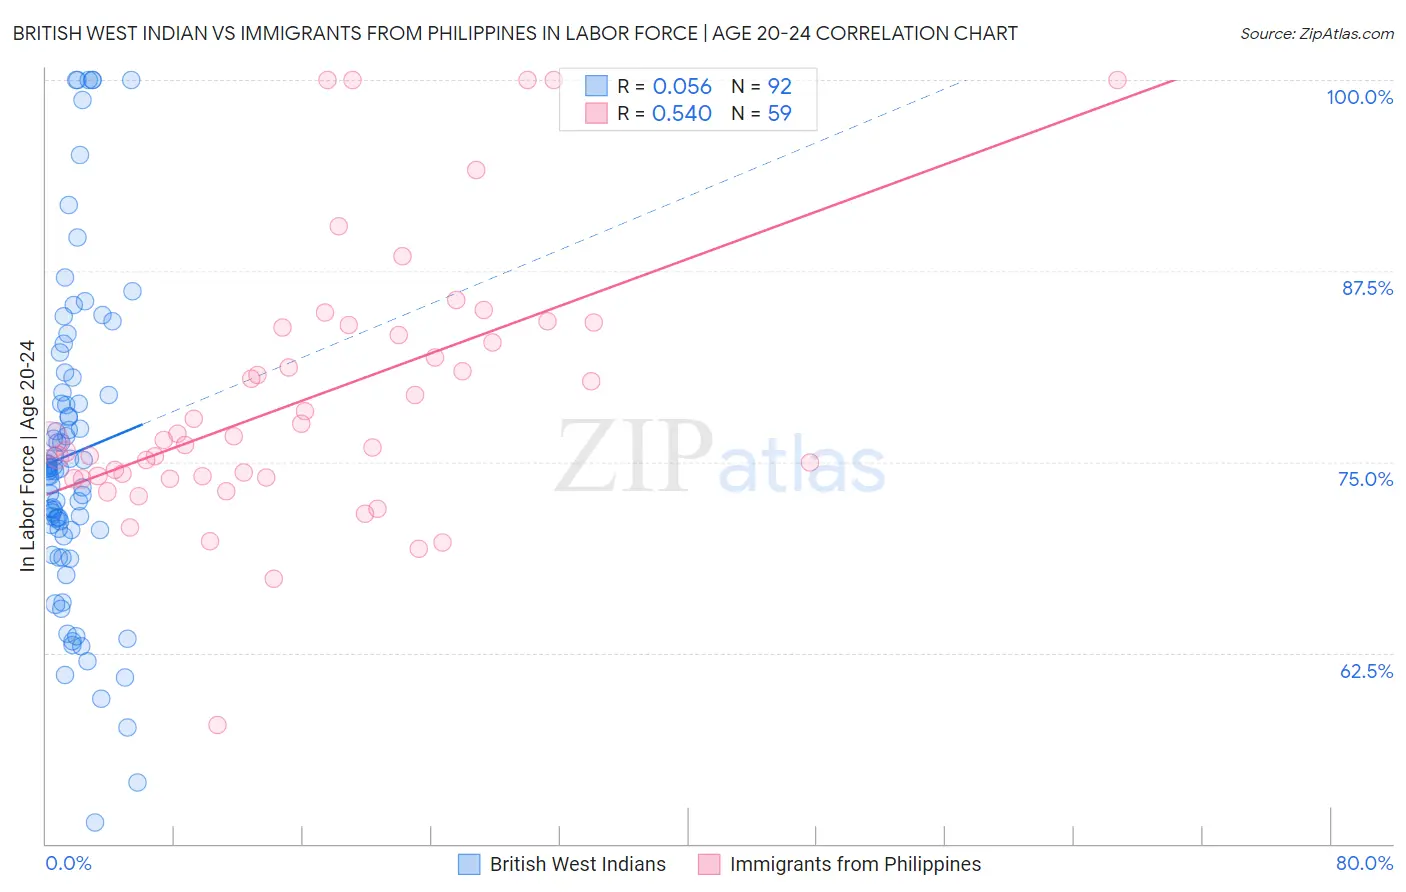
British West Indian vs Immigrants from Philippines In Labor Force | Age 20-24 Correlation Chart
The statistical analysis conducted on geographies consisting of 152,699,187 people shows a slight positive correlation between the proportion of British West Indians and labor force participation rate among population between the ages 20 and 24 in the United States with a correlation coefficient (R) of 0.056 and weighted average of 70.0%. Similarly, the statistical analysis conducted on geographies consisting of 470,994,920 people shows a substantial positive correlation between the proportion of Immigrants from Philippines and labor force participation rate among population between the ages 20 and 24 in the United States with a correlation coefficient (R) of 0.540 and weighted average of 75.1%, a difference of 7.3%.
In Labor Force | Age 20-24 Correlation Summary
| Measurement | British West Indian | Immigrants from Philippines |
| Minimum | 51.4% | 57.8% |
| Maximum | 100.0% | 100.0% |
| Range | 48.6% | 42.2% |
| Mean | 75.5% | 79.2% |
| Median | 74.5% | 76.5% |
| Interquartile 25% (IQ1) | 70.5% | 74.0% |
| Interquartile 75% (IQ3) | 79.5% | 83.8% |
| Interquartile Range (IQR) | 9.0% | 9.8% |
| Standard Deviation (Sample) | 10.5% | 8.7% |
| Standard Deviation (Population) | 10.4% | 8.6% |
Similar Demographics by In Labor Force | Age 20-24
Demographics Similar to British West Indians by In Labor Force | Age 20-24
In terms of in labor force | age 20-24, the demographic groups most similar to British West Indians are Immigrants from Barbados (69.7%, a difference of 0.35%), Yuman (70.3%, a difference of 0.41%), Immigrants from Uzbekistan (70.4%, a difference of 0.63%), Immigrants from Bangladesh (70.6%, a difference of 0.94%), and Vietnamese (70.6%, a difference of 0.96%).
| Demographics | Rating | Rank | In Labor Force | Age 20-24 |
| Immigrants | Trinidad and Tobago | 0.0 /100 | #327 | Tragic 71.1% |
| Immigrants | China | 0.0 /100 | #328 | Tragic 71.1% |
| Yup'ik | 0.0 /100 | #329 | Tragic 70.9% |
| Vietnamese | 0.0 /100 | #330 | Tragic 70.6% |
| Immigrants | Bangladesh | 0.0 /100 | #331 | Tragic 70.6% |
| Immigrants | Uzbekistan | 0.0 /100 | #332 | Tragic 70.4% |
| Yuman | 0.0 /100 | #333 | Tragic 70.3% |
| British West Indians | 0.0 /100 | #334 | Tragic 70.0% |
| Immigrants | Barbados | 0.0 /100 | #335 | Tragic 69.7% |
| Immigrants | Guyana | 0.0 /100 | #336 | Tragic 69.3% |
| Guyanese | 0.0 /100 | #337 | Tragic 69.2% |
| Pima | 0.0 /100 | #338 | Tragic 69.0% |
| Immigrants | Yemen | 0.0 /100 | #339 | Tragic 68.9% |
| Menominee | 0.0 /100 | #340 | Tragic 68.7% |
| Tohono O'odham | 0.0 /100 | #341 | Tragic 68.6% |
Demographics Similar to Immigrants from Philippines by In Labor Force | Age 20-24
In terms of in labor force | age 20-24, the demographic groups most similar to Immigrants from Philippines are Immigrants from Western Africa (75.1%, a difference of 0.010%), Immigrants from South Eastern Asia (75.1%, a difference of 0.030%), Mexican (75.1%, a difference of 0.050%), Cambodian (75.2%, a difference of 0.070%), and Cajun (75.1%, a difference of 0.070%).
| Demographics | Rating | Rank | In Labor Force | Age 20-24 |
| Immigrants | Romania | 64.6 /100 | #162 | Good 75.2% |
| Costa Ricans | 64.2 /100 | #163 | Good 75.2% |
| Bolivians | 64.0 /100 | #164 | Good 75.2% |
| Afghans | 63.5 /100 | #165 | Good 75.2% |
| Cambodians | 60.5 /100 | #166 | Good 75.2% |
| Immigrants | South Eastern Asia | 57.5 /100 | #167 | Average 75.1% |
| Immigrants | Western Africa | 56.7 /100 | #168 | Average 75.1% |
| Immigrants | Philippines | 55.8 /100 | #169 | Average 75.1% |
| Mexicans | 52.1 /100 | #170 | Average 75.1% |
| Cajuns | 51.1 /100 | #171 | Average 75.1% |
| Yakama | 50.8 /100 | #172 | Average 75.1% |
| Immigrants | Croatia | 50.2 /100 | #173 | Average 75.1% |
| South Africans | 50.0 /100 | #174 | Average 75.0% |
| Syrians | 49.5 /100 | #175 | Average 75.0% |
| Central Americans | 48.7 /100 | #176 | Average 75.0% |