Immigrants from Ukraine vs Trinidadian and Tobagonian In Labor Force | Age 20-24
COMPARE
Immigrants from Ukraine
Trinidadian and Tobagonian
In Labor Force | Age 20-24
In Labor Force | Age 20-24 Comparison
Immigrants from Ukraine
Trinidadians and Tobagonians
74.2%
IN LABOR FORCE | AGE 20-24
5.1/ 100
METRIC RATING
228th/ 347
METRIC RANK
71.5%
IN LABOR FORCE | AGE 20-24
0.0/ 100
METRIC RATING
320th/ 347
METRIC RANK
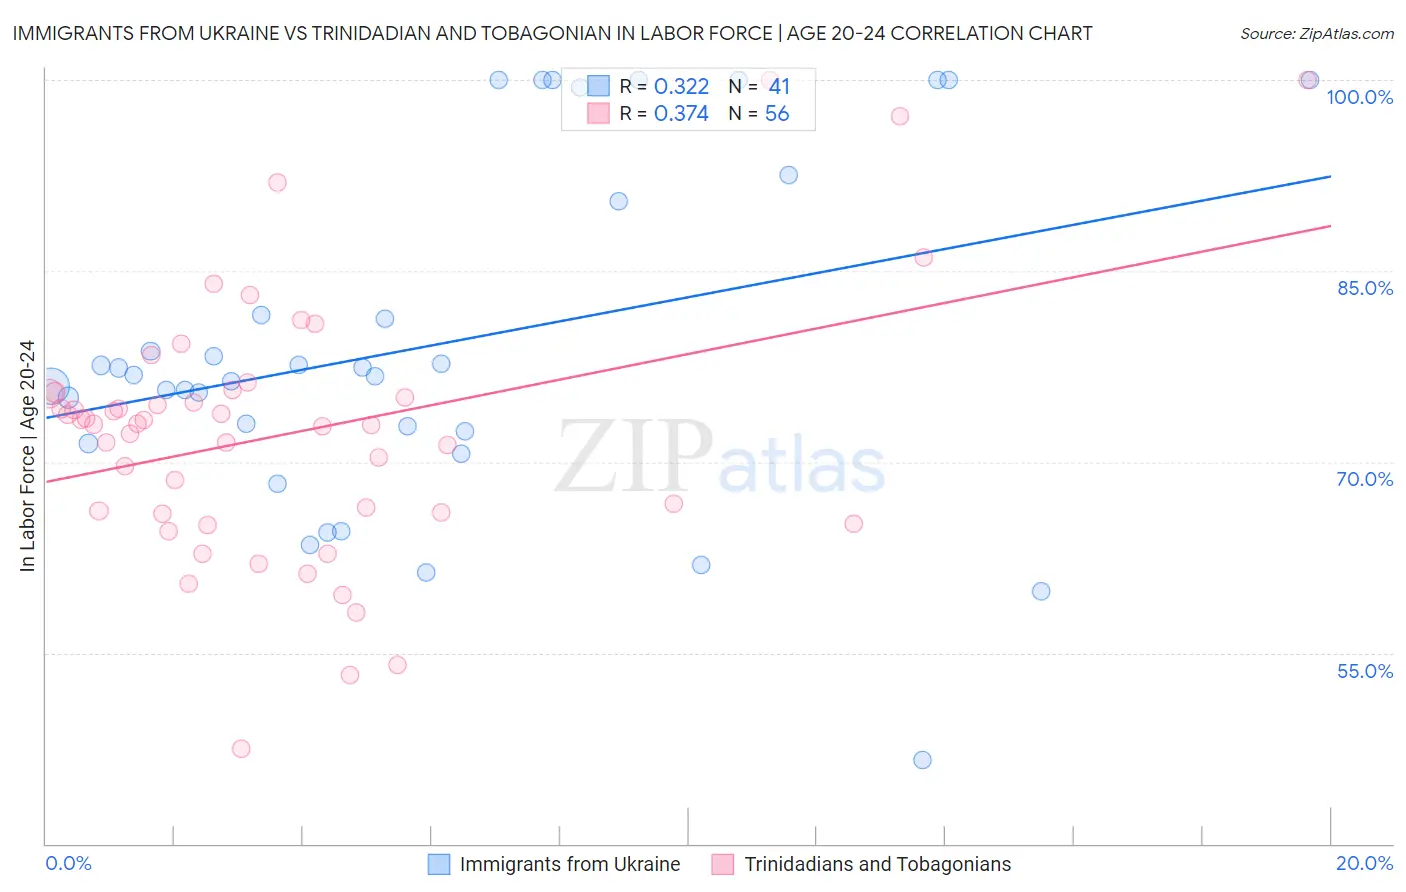
Immigrants from Ukraine vs Trinidadian and Tobagonian In Labor Force | Age 20-24 Correlation Chart
The statistical analysis conducted on geographies consisting of 289,649,876 people shows a mild positive correlation between the proportion of Immigrants from Ukraine and labor force participation rate among population between the ages 20 and 24 in the United States with a correlation coefficient (R) of 0.322 and weighted average of 74.2%. Similarly, the statistical analysis conducted on geographies consisting of 219,866,832 people shows a mild positive correlation between the proportion of Trinidadians and Tobagonians and labor force participation rate among population between the ages 20 and 24 in the United States with a correlation coefficient (R) of 0.374 and weighted average of 71.5%, a difference of 3.8%.
In Labor Force | Age 20-24 Correlation Summary
| Measurement | Immigrants from Ukraine | Trinidadian and Tobagonian |
| Minimum | 46.6% | 47.5% |
| Maximum | 100.0% | 100.0% |
| Range | 53.4% | 52.5% |
| Mean | 79.2% | 72.3% |
| Median | 76.9% | 73.0% |
| Interquartile 25% (IQ1) | 71.9% | 66.0% |
| Interquartile 75% (IQ3) | 91.5% | 75.4% |
| Interquartile Range (IQR) | 19.6% | 9.4% |
| Standard Deviation (Sample) | 13.6% | 10.4% |
| Standard Deviation (Population) | 13.4% | 10.3% |
Similar Demographics by In Labor Force | Age 20-24
Demographics Similar to Immigrants from Ukraine by In Labor Force | Age 20-24
In terms of in labor force | age 20-24, the demographic groups most similar to Immigrants from Ukraine are Immigrants from Sweden (74.2%, a difference of 0.040%), Immigrants from Ireland (74.3%, a difference of 0.050%), Immigrants from Fiji (74.3%, a difference of 0.060%), Immigrants from Albania (74.2%, a difference of 0.060%), and Ghanaian (74.3%, a difference of 0.080%).
| Demographics | Rating | Rank | In Labor Force | Age 20-24 |
| Chickasaw | 10.3 /100 | #221 | Poor 74.5% |
| Immigrants | India | 9.9 /100 | #222 | Tragic 74.4% |
| Hispanics or Latinos | 7.9 /100 | #223 | Tragic 74.4% |
| Seminole | 6.9 /100 | #224 | Tragic 74.3% |
| Ghanaians | 6.2 /100 | #225 | Tragic 74.3% |
| Immigrants | Fiji | 5.9 /100 | #226 | Tragic 74.3% |
| Immigrants | Ireland | 5.8 /100 | #227 | Tragic 74.3% |
| Immigrants | Ukraine | 5.1 /100 | #228 | Tragic 74.2% |
| Immigrants | Sweden | 4.6 /100 | #229 | Tragic 74.2% |
| Immigrants | Albania | 4.3 /100 | #230 | Tragic 74.2% |
| Immigrants | Greece | 4.1 /100 | #231 | Tragic 74.2% |
| Immigrants | Switzerland | 4.1 /100 | #232 | Tragic 74.2% |
| Immigrants | Chile | 3.7 /100 | #233 | Tragic 74.1% |
| Immigrants | Immigrants | 3.6 /100 | #234 | Tragic 74.1% |
| Laotians | 3.5 /100 | #235 | Tragic 74.1% |
Demographics Similar to Trinidadians and Tobagonians by In Labor Force | Age 20-24
In terms of in labor force | age 20-24, the demographic groups most similar to Trinidadians and Tobagonians are Immigrants from Taiwan (71.5%, a difference of 0.050%), Immigrants from Israel (71.6%, a difference of 0.080%), Immigrants from Hong Kong (71.6%, a difference of 0.11%), Filipino (71.4%, a difference of 0.18%), and Immigrants from Armenia (71.7%, a difference of 0.20%).
| Demographics | Rating | Rank | In Labor Force | Age 20-24 |
| Immigrants | Dominica | 0.0 /100 | #313 | Tragic 71.9% |
| Indians (Asian) | 0.0 /100 | #314 | Tragic 71.9% |
| Immigrants | Iran | 0.0 /100 | #315 | Tragic 71.8% |
| Immigrants | Eastern Asia | 0.0 /100 | #316 | Tragic 71.8% |
| Immigrants | Armenia | 0.0 /100 | #317 | Tragic 71.7% |
| Immigrants | Hong Kong | 0.0 /100 | #318 | Tragic 71.6% |
| Immigrants | Israel | 0.0 /100 | #319 | Tragic 71.6% |
| Trinidadians and Tobagonians | 0.0 /100 | #320 | Tragic 71.5% |
| Immigrants | Taiwan | 0.0 /100 | #321 | Tragic 71.5% |
| Filipinos | 0.0 /100 | #322 | Tragic 71.4% |
| West Indians | 0.0 /100 | #323 | Tragic 71.3% |
| Immigrants | Dominican Republic | 0.0 /100 | #324 | Tragic 71.2% |
| Barbadians | 0.0 /100 | #325 | Tragic 71.1% |
| Dominicans | 0.0 /100 | #326 | Tragic 71.1% |
| Immigrants | Trinidad and Tobago | 0.0 /100 | #327 | Tragic 71.1% |