British West Indian vs Alaskan Athabascan In Labor Force | Age 20-24
COMPARE
British West Indian
Alaskan Athabascan
In Labor Force | Age 20-24
In Labor Force | Age 20-24 Comparison
British West Indians
Alaskan Athabascans
70.0%
IN LABOR FORCE | AGE 20-24
0.0/ 100
METRIC RATING
334th/ 347
METRIC RANK
79.1%
IN LABOR FORCE | AGE 20-24
100.0/ 100
METRIC RATING
4th/ 347
METRIC RANK
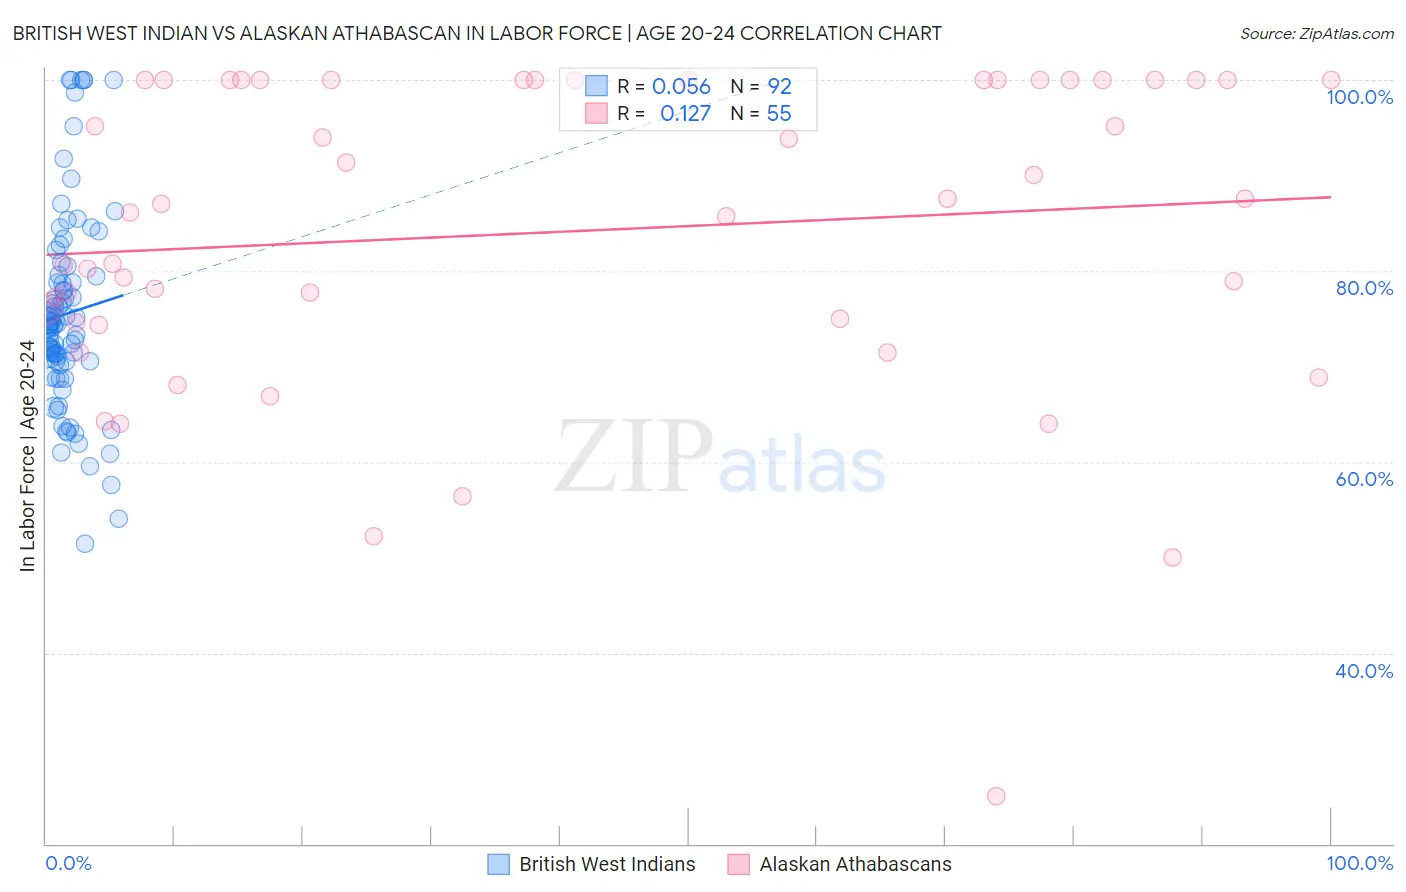
British West Indian vs Alaskan Athabascan In Labor Force | Age 20-24 Correlation Chart
The statistical analysis conducted on geographies consisting of 152,699,187 people shows a slight positive correlation between the proportion of British West Indians and labor force participation rate among population between the ages 20 and 24 in the United States with a correlation coefficient (R) of 0.056 and weighted average of 70.0%. Similarly, the statistical analysis conducted on geographies consisting of 45,812,845 people shows a poor positive correlation between the proportion of Alaskan Athabascans and labor force participation rate among population between the ages 20 and 24 in the United States with a correlation coefficient (R) of 0.127 and weighted average of 79.1%, a difference of 13.1%.
In Labor Force | Age 20-24 Correlation Summary
| Measurement | British West Indian | Alaskan Athabascan |
| Minimum | 51.4% | 25.0% |
| Maximum | 100.0% | 100.0% |
| Range | 48.6% | 75.0% |
| Mean | 75.5% | 84.1% |
| Median | 74.5% | 87.1% |
| Interquartile 25% (IQ1) | 70.5% | 74.6% |
| Interquartile 75% (IQ3) | 79.5% | 100.0% |
| Interquartile Range (IQR) | 9.0% | 25.4% |
| Standard Deviation (Sample) | 10.5% | 16.5% |
| Standard Deviation (Population) | 10.4% | 16.3% |
Similar Demographics by In Labor Force | Age 20-24
Demographics Similar to British West Indians by In Labor Force | Age 20-24
In terms of in labor force | age 20-24, the demographic groups most similar to British West Indians are Immigrants from Barbados (69.7%, a difference of 0.35%), Yuman (70.3%, a difference of 0.41%), Immigrants from Uzbekistan (70.4%, a difference of 0.63%), Immigrants from Bangladesh (70.6%, a difference of 0.94%), and Vietnamese (70.6%, a difference of 0.96%).
| Demographics | Rating | Rank | In Labor Force | Age 20-24 |
| Immigrants | Trinidad and Tobago | 0.0 /100 | #327 | Tragic 71.1% |
| Immigrants | China | 0.0 /100 | #328 | Tragic 71.1% |
| Yup'ik | 0.0 /100 | #329 | Tragic 70.9% |
| Vietnamese | 0.0 /100 | #330 | Tragic 70.6% |
| Immigrants | Bangladesh | 0.0 /100 | #331 | Tragic 70.6% |
| Immigrants | Uzbekistan | 0.0 /100 | #332 | Tragic 70.4% |
| Yuman | 0.0 /100 | #333 | Tragic 70.3% |
| British West Indians | 0.0 /100 | #334 | Tragic 70.0% |
| Immigrants | Barbados | 0.0 /100 | #335 | Tragic 69.7% |
| Immigrants | Guyana | 0.0 /100 | #336 | Tragic 69.3% |
| Guyanese | 0.0 /100 | #337 | Tragic 69.2% |
| Pima | 0.0 /100 | #338 | Tragic 69.0% |
| Immigrants | Yemen | 0.0 /100 | #339 | Tragic 68.9% |
| Menominee | 0.0 /100 | #340 | Tragic 68.7% |
| Tohono O'odham | 0.0 /100 | #341 | Tragic 68.6% |
Demographics Similar to Alaskan Athabascans by In Labor Force | Age 20-24
In terms of in labor force | age 20-24, the demographic groups most similar to Alaskan Athabascans are Aleut (79.0%, a difference of 0.14%), Danish (79.0%, a difference of 0.15%), Somali (79.3%, a difference of 0.19%), Luxembourger (79.0%, a difference of 0.19%), and Immigrants from Cabo Verde (78.9%, a difference of 0.30%).
| Demographics | Rating | Rank | In Labor Force | Age 20-24 |
| Norwegians | 100.0 /100 | #1 | Exceptional 80.1% |
| Immigrants | Somalia | 100.0 /100 | #2 | Exceptional 79.5% |
| Somalis | 100.0 /100 | #3 | Exceptional 79.3% |
| Alaskan Athabascans | 100.0 /100 | #4 | Exceptional 79.1% |
| Aleuts | 100.0 /100 | #5 | Exceptional 79.0% |
| Danes | 100.0 /100 | #6 | Exceptional 79.0% |
| Luxembourgers | 100.0 /100 | #7 | Exceptional 79.0% |
| Immigrants | Cabo Verde | 100.0 /100 | #8 | Exceptional 78.9% |
| Swedes | 100.0 /100 | #9 | Exceptional 78.8% |
| Slovenes | 100.0 /100 | #10 | Exceptional 78.7% |
| Finns | 100.0 /100 | #11 | Exceptional 78.7% |
| Germans | 100.0 /100 | #12 | Exceptional 78.6% |
| Scandinavians | 100.0 /100 | #13 | Exceptional 78.5% |
| Czechs | 100.0 /100 | #14 | Exceptional 78.5% |
| Sudanese | 100.0 /100 | #15 | Exceptional 78.4% |