British West Indian vs Alaskan Athabascan Unemployment Among Ages 16 to 19 years
COMPARE
British West Indian
Alaskan Athabascan
Unemployment Among Ages 16 to 19 years
Unemployment Among Ages 16 to 19 years Comparison
British West Indians
Alaskan Athabascans
24.0%
UNEMPLOYMENT AMONG AGES 16 TO 19 YEARS
0.0/ 100
METRIC RATING
331st/ 347
METRIC RANK
17.7%
UNEMPLOYMENT AMONG AGES 16 TO 19 YEARS
34.1/ 100
METRIC RATING
196th/ 347
METRIC RANK
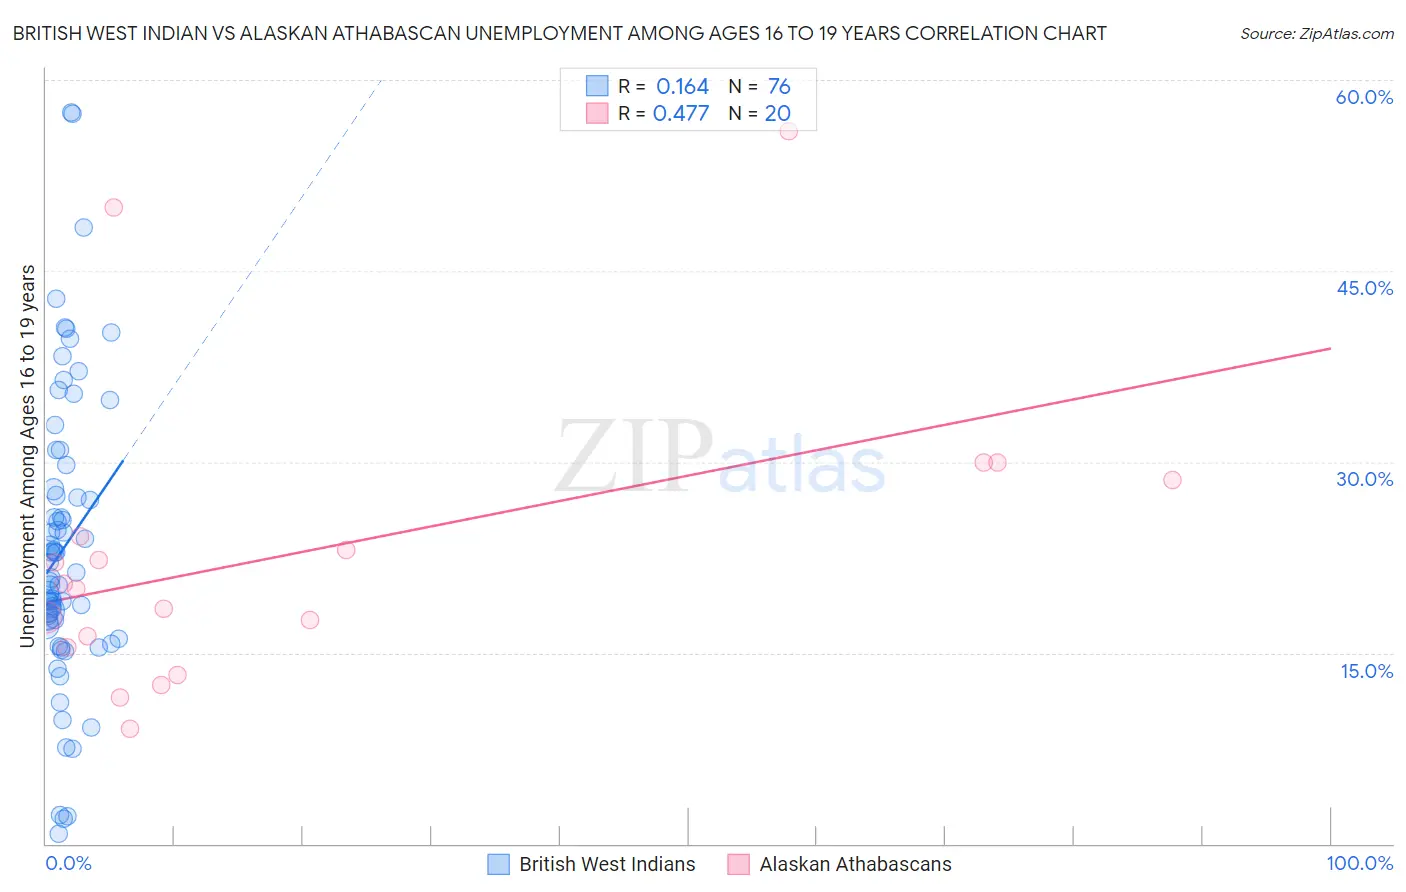
British West Indian vs Alaskan Athabascan Unemployment Among Ages 16 to 19 years Correlation Chart
The statistical analysis conducted on geographies consisting of 149,818,612 people shows a poor positive correlation between the proportion of British West Indians and unemployment rate among population between the ages 16 and 19 in the United States with a correlation coefficient (R) of 0.164 and weighted average of 24.0%. Similarly, the statistical analysis conducted on geographies consisting of 45,046,237 people shows a moderate positive correlation between the proportion of Alaskan Athabascans and unemployment rate among population between the ages 16 and 19 in the United States with a correlation coefficient (R) of 0.477 and weighted average of 17.7%, a difference of 35.4%.
Unemployment Among Ages 16 to 19 years Correlation Summary
| Measurement | British West Indian | Alaskan Athabascan |
| Minimum | 0.80% | 9.0% |
| Maximum | 57.4% | 56.0% |
| Range | 56.6% | 47.0% |
| Mean | 23.2% | 22.9% |
| Median | 21.1% | 20.2% |
| Interquartile 25% (IQ1) | 17.3% | 15.9% |
| Interquartile 75% (IQ3) | 27.6% | 26.4% |
| Interquartile Range (IQR) | 10.3% | 10.5% |
| Standard Deviation (Sample) | 11.4% | 11.9% |
| Standard Deviation (Population) | 11.3% | 11.6% |
Similar Demographics by Unemployment Among Ages 16 to 19 years
Demographics Similar to British West Indians by Unemployment Among Ages 16 to 19 years
In terms of unemployment among ages 16 to 19 years, the demographic groups most similar to British West Indians are Immigrants from Barbados (24.0%, a difference of 0.17%), Dominican (23.6%, a difference of 1.4%), Paiute (24.4%, a difference of 1.6%), Tlingit-Haida (23.5%, a difference of 1.8%), and Immigrants from Dominican Republic (23.3%, a difference of 2.9%).
| Demographics | Rating | Rank | Unemployment Among Ages 16 to 19 years |
| Immigrants | Armenia | 0.0 /100 | #324 | Tragic 22.6% |
| Trinidadians and Tobagonians | 0.0 /100 | #325 | Tragic 22.6% |
| Immigrants | Trinidad and Tobago | 0.0 /100 | #326 | Tragic 23.1% |
| Pima | 0.0 /100 | #327 | Tragic 23.1% |
| Immigrants | Dominican Republic | 0.0 /100 | #328 | Tragic 23.3% |
| Tlingit-Haida | 0.0 /100 | #329 | Tragic 23.5% |
| Dominicans | 0.0 /100 | #330 | Tragic 23.6% |
| British West Indians | 0.0 /100 | #331 | Tragic 24.0% |
| Immigrants | Barbados | 0.0 /100 | #332 | Tragic 24.0% |
| Paiute | 0.0 /100 | #333 | Tragic 24.4% |
| Guyanese | 0.0 /100 | #334 | Tragic 24.8% |
| Arapaho | 0.0 /100 | #335 | Tragic 25.2% |
| Kiowa | 0.0 /100 | #336 | Tragic 25.2% |
| Immigrants | Guyana | 0.0 /100 | #337 | Tragic 25.5% |
| Immigrants | St. Vincent and the Grenadines | 0.0 /100 | #338 | Tragic 25.7% |
Demographics Similar to Alaskan Athabascans by Unemployment Among Ages 16 to 19 years
In terms of unemployment among ages 16 to 19 years, the demographic groups most similar to Alaskan Athabascans are Immigrants from Peru (17.7%, a difference of 0.16%), Immigrants from Czechoslovakia (17.8%, a difference of 0.23%), Peruvian (17.7%, a difference of 0.24%), Ethiopian (17.8%, a difference of 0.24%), and Immigrants from Ireland (17.8%, a difference of 0.30%).
| Demographics | Rating | Rank | Unemployment Among Ages 16 to 19 years |
| Immigrants | Europe | 41.8 /100 | #189 | Average 17.6% |
| Marshallese | 41.7 /100 | #190 | Average 17.6% |
| Immigrants | Costa Rica | 41.3 /100 | #191 | Average 17.6% |
| Immigrants | Philippines | 40.7 /100 | #192 | Average 17.7% |
| Immigrants | Australia | 40.6 /100 | #193 | Average 17.7% |
| Peruvians | 38.8 /100 | #194 | Fair 17.7% |
| Immigrants | Peru | 37.3 /100 | #195 | Fair 17.7% |
| Alaskan Athabascans | 34.1 /100 | #196 | Fair 17.7% |
| Immigrants | Czechoslovakia | 29.8 /100 | #197 | Fair 17.8% |
| Ethiopians | 29.6 /100 | #198 | Fair 17.8% |
| Immigrants | Ireland | 28.5 /100 | #199 | Fair 17.8% |
| Immigrants | Fiji | 27.7 /100 | #200 | Fair 17.8% |
| Immigrants | Ethiopia | 27.4 /100 | #201 | Fair 17.8% |
| Immigrants | Portugal | 27.2 /100 | #202 | Fair 17.8% |
| Immigrants | Eastern Europe | 23.6 /100 | #203 | Fair 17.8% |