Immigrants from North Macedonia vs Alaskan Athabascan In Labor Force | Age 20-24
COMPARE
Immigrants from North Macedonia
Alaskan Athabascan
In Labor Force | Age 20-24
In Labor Force | Age 20-24 Comparison
Immigrants from North Macedonia
Alaskan Athabascans
76.1%
IN LABOR FORCE | AGE 20-24
97.5/ 100
METRIC RATING
103rd/ 347
METRIC RANK
79.1%
IN LABOR FORCE | AGE 20-24
100.0/ 100
METRIC RATING
4th/ 347
METRIC RANK
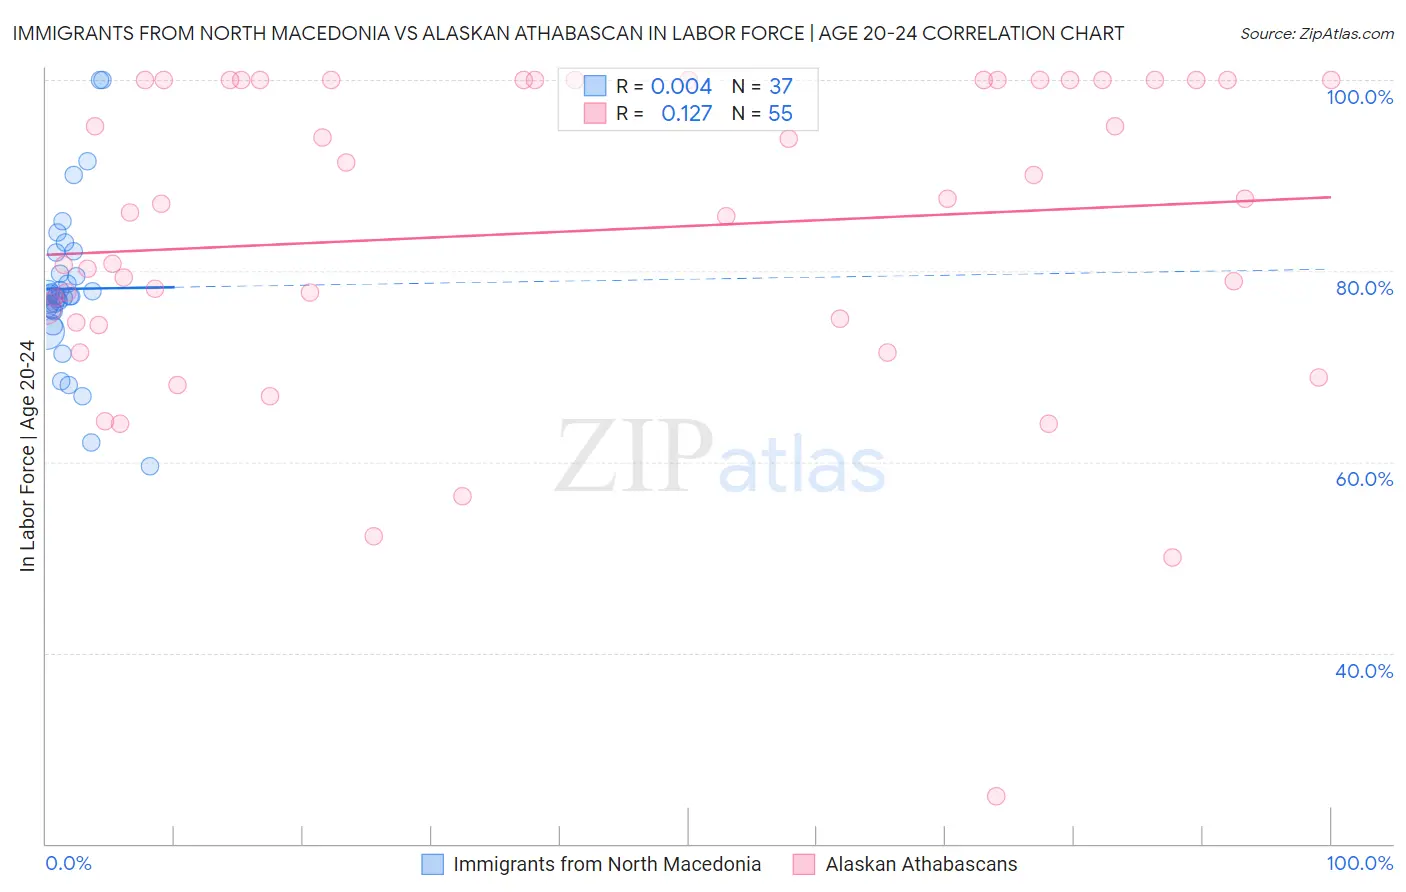
Immigrants from North Macedonia vs Alaskan Athabascan In Labor Force | Age 20-24 Correlation Chart
The statistical analysis conducted on geographies consisting of 74,315,577 people shows no correlation between the proportion of Immigrants from North Macedonia and labor force participation rate among population between the ages 20 and 24 in the United States with a correlation coefficient (R) of 0.004 and weighted average of 76.1%. Similarly, the statistical analysis conducted on geographies consisting of 45,812,845 people shows a poor positive correlation between the proportion of Alaskan Athabascans and labor force participation rate among population between the ages 20 and 24 in the United States with a correlation coefficient (R) of 0.127 and weighted average of 79.1%, a difference of 4.0%.
In Labor Force | Age 20-24 Correlation Summary
| Measurement | Immigrants from North Macedonia | Alaskan Athabascan |
| Minimum | 59.5% | 25.0% |
| Maximum | 100.0% | 100.0% |
| Range | 40.5% | 75.0% |
| Mean | 78.1% | 84.1% |
| Median | 77.4% | 87.1% |
| Interquartile 25% (IQ1) | 75.8% | 74.6% |
| Interquartile 75% (IQ3) | 80.8% | 100.0% |
| Interquartile Range (IQR) | 5.0% | 25.4% |
| Standard Deviation (Sample) | 8.3% | 16.5% |
| Standard Deviation (Population) | 8.1% | 16.3% |
Similar Demographics by In Labor Force | Age 20-24
Demographics Similar to Immigrants from North Macedonia by In Labor Force | Age 20-24
In terms of in labor force | age 20-24, the demographic groups most similar to Immigrants from North Macedonia are Latvian (76.1%, a difference of 0.020%), Immigrants from Poland (76.1%, a difference of 0.030%), Shoshone (76.1%, a difference of 0.040%), Macedonian (76.0%, a difference of 0.040%), and Immigrants from Nepal (76.0%, a difference of 0.040%).
| Demographics | Rating | Rank | In Labor Force | Age 20-24 |
| Immigrants | Nonimmigrants | 98.5 /100 | #96 | Exceptional 76.2% |
| Immigrants | Lithuania | 98.0 /100 | #97 | Exceptional 76.1% |
| Immigrants | Oceania | 98.0 /100 | #98 | Exceptional 76.1% |
| Americans | 97.8 /100 | #99 | Exceptional 76.1% |
| Shoshone | 97.8 /100 | #100 | Exceptional 76.1% |
| Immigrants | Poland | 97.7 /100 | #101 | Exceptional 76.1% |
| Latvians | 97.6 /100 | #102 | Exceptional 76.1% |
| Immigrants | North Macedonia | 97.5 /100 | #103 | Exceptional 76.1% |
| Macedonians | 97.2 /100 | #104 | Exceptional 76.0% |
| Immigrants | Nepal | 97.2 /100 | #105 | Exceptional 76.0% |
| Immigrants | Uganda | 97.1 /100 | #106 | Exceptional 76.0% |
| Greeks | 96.9 /100 | #107 | Exceptional 76.0% |
| Iraqis | 96.6 /100 | #108 | Exceptional 76.0% |
| Cherokee | 95.8 /100 | #109 | Exceptional 75.9% |
| Immigrants | Morocco | 95.8 /100 | #110 | Exceptional 75.9% |
Demographics Similar to Alaskan Athabascans by In Labor Force | Age 20-24
In terms of in labor force | age 20-24, the demographic groups most similar to Alaskan Athabascans are Aleut (79.0%, a difference of 0.14%), Danish (79.0%, a difference of 0.15%), Somali (79.3%, a difference of 0.19%), Luxembourger (79.0%, a difference of 0.19%), and Immigrants from Cabo Verde (78.9%, a difference of 0.30%).
| Demographics | Rating | Rank | In Labor Force | Age 20-24 |
| Norwegians | 100.0 /100 | #1 | Exceptional 80.1% |
| Immigrants | Somalia | 100.0 /100 | #2 | Exceptional 79.5% |
| Somalis | 100.0 /100 | #3 | Exceptional 79.3% |
| Alaskan Athabascans | 100.0 /100 | #4 | Exceptional 79.1% |
| Aleuts | 100.0 /100 | #5 | Exceptional 79.0% |
| Danes | 100.0 /100 | #6 | Exceptional 79.0% |
| Luxembourgers | 100.0 /100 | #7 | Exceptional 79.0% |
| Immigrants | Cabo Verde | 100.0 /100 | #8 | Exceptional 78.9% |
| Swedes | 100.0 /100 | #9 | Exceptional 78.8% |
| Slovenes | 100.0 /100 | #10 | Exceptional 78.7% |
| Finns | 100.0 /100 | #11 | Exceptional 78.7% |
| Germans | 100.0 /100 | #12 | Exceptional 78.6% |
| Scandinavians | 100.0 /100 | #13 | Exceptional 78.5% |
| Czechs | 100.0 /100 | #14 | Exceptional 78.5% |
| Sudanese | 100.0 /100 | #15 | Exceptional 78.4% |