Swiss vs Alaskan Athabascan In Labor Force | Age 20-24
COMPARE
Swiss
Alaskan Athabascan
In Labor Force | Age 20-24
In Labor Force | Age 20-24 Comparison
Swiss
Alaskan Athabascans
77.7%
IN LABOR FORCE | AGE 20-24
100.0/ 100
METRIC RATING
30th/ 347
METRIC RANK
79.1%
IN LABOR FORCE | AGE 20-24
100.0/ 100
METRIC RATING
4th/ 347
METRIC RANK
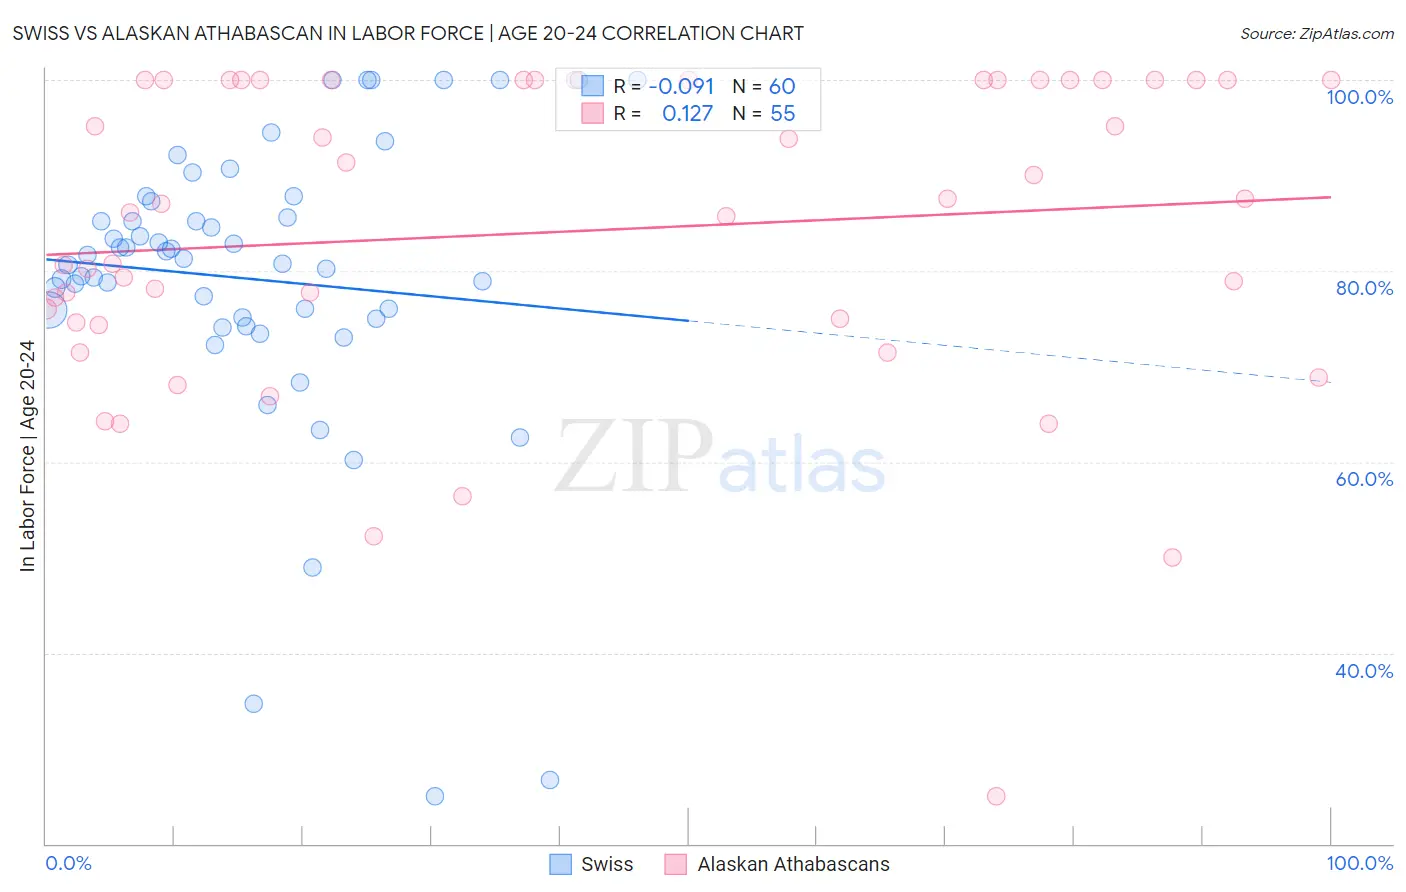
Swiss vs Alaskan Athabascan In Labor Force | Age 20-24 Correlation Chart
The statistical analysis conducted on geographies consisting of 464,562,174 people shows a slight negative correlation between the proportion of Swiss and labor force participation rate among population between the ages 20 and 24 in the United States with a correlation coefficient (R) of -0.091 and weighted average of 77.7%. Similarly, the statistical analysis conducted on geographies consisting of 45,812,845 people shows a poor positive correlation between the proportion of Alaskan Athabascans and labor force participation rate among population between the ages 20 and 24 in the United States with a correlation coefficient (R) of 0.127 and weighted average of 79.1%, a difference of 1.8%.
In Labor Force | Age 20-24 Correlation Summary
| Measurement | Swiss | Alaskan Athabascan |
| Minimum | 25.0% | 25.0% |
| Maximum | 100.0% | 100.0% |
| Range | 75.0% | 75.0% |
| Mean | 79.1% | 84.1% |
| Median | 81.0% | 87.1% |
| Interquartile 25% (IQ1) | 75.0% | 74.6% |
| Interquartile 75% (IQ3) | 86.5% | 100.0% |
| Interquartile Range (IQR) | 11.4% | 25.4% |
| Standard Deviation (Sample) | 15.6% | 16.5% |
| Standard Deviation (Population) | 15.5% | 16.3% |
Similar Demographics by In Labor Force | Age 20-24
Demographics Similar to Swiss by In Labor Force | Age 20-24
In terms of in labor force | age 20-24, the demographic groups most similar to Swiss are Slovak (77.7%, a difference of 0.020%), Belgian (77.8%, a difference of 0.10%), Polish (77.6%, a difference of 0.12%), Immigrants from Micronesia (77.8%, a difference of 0.14%), and English (77.6%, a difference of 0.18%).
| Demographics | Rating | Rank | In Labor Force | Age 20-24 |
| Yugoslavians | 100.0 /100 | #23 | Exceptional 78.0% |
| Liberians | 100.0 /100 | #24 | Exceptional 78.0% |
| Tlingit-Haida | 100.0 /100 | #25 | Exceptional 77.9% |
| Tongans | 100.0 /100 | #26 | Exceptional 77.9% |
| Immigrants | Micronesia | 100.0 /100 | #27 | Exceptional 77.8% |
| Belgians | 100.0 /100 | #28 | Exceptional 77.8% |
| Slovaks | 100.0 /100 | #29 | Exceptional 77.7% |
| Swiss | 100.0 /100 | #30 | Exceptional 77.7% |
| Poles | 100.0 /100 | #31 | Exceptional 77.6% |
| English | 100.0 /100 | #32 | Exceptional 77.6% |
| Immigrants | Ethiopia | 100.0 /100 | #33 | Exceptional 77.5% |
| German Russians | 100.0 /100 | #34 | Exceptional 77.5% |
| Immigrants | Eastern Africa | 100.0 /100 | #35 | Exceptional 77.5% |
| Welsh | 100.0 /100 | #36 | Exceptional 77.5% |
| Czechoslovakians | 100.0 /100 | #37 | Exceptional 77.5% |
Demographics Similar to Alaskan Athabascans by In Labor Force | Age 20-24
In terms of in labor force | age 20-24, the demographic groups most similar to Alaskan Athabascans are Aleut (79.0%, a difference of 0.14%), Danish (79.0%, a difference of 0.15%), Somali (79.3%, a difference of 0.19%), Luxembourger (79.0%, a difference of 0.19%), and Immigrants from Cabo Verde (78.9%, a difference of 0.30%).
| Demographics | Rating | Rank | In Labor Force | Age 20-24 |
| Norwegians | 100.0 /100 | #1 | Exceptional 80.1% |
| Immigrants | Somalia | 100.0 /100 | #2 | Exceptional 79.5% |
| Somalis | 100.0 /100 | #3 | Exceptional 79.3% |
| Alaskan Athabascans | 100.0 /100 | #4 | Exceptional 79.1% |
| Aleuts | 100.0 /100 | #5 | Exceptional 79.0% |
| Danes | 100.0 /100 | #6 | Exceptional 79.0% |
| Luxembourgers | 100.0 /100 | #7 | Exceptional 79.0% |
| Immigrants | Cabo Verde | 100.0 /100 | #8 | Exceptional 78.9% |
| Swedes | 100.0 /100 | #9 | Exceptional 78.8% |
| Slovenes | 100.0 /100 | #10 | Exceptional 78.7% |
| Finns | 100.0 /100 | #11 | Exceptional 78.7% |
| Germans | 100.0 /100 | #12 | Exceptional 78.6% |
| Scandinavians | 100.0 /100 | #13 | Exceptional 78.5% |
| Czechs | 100.0 /100 | #14 | Exceptional 78.5% |
| Sudanese | 100.0 /100 | #15 | Exceptional 78.4% |