British West Indian vs Alaskan Athabascan In Labor Force | Age 45-54
COMPARE
British West Indian
Alaskan Athabascan
In Labor Force | Age 45-54
In Labor Force | Age 45-54 Comparison
British West Indians
Alaskan Athabascans
81.2%
IN LABOR FORCE | AGE 45-54
0.0/ 100
METRIC RATING
274th/ 347
METRIC RANK
81.8%
IN LABOR FORCE | AGE 45-54
0.4/ 100
METRIC RATING
246th/ 347
METRIC RANK
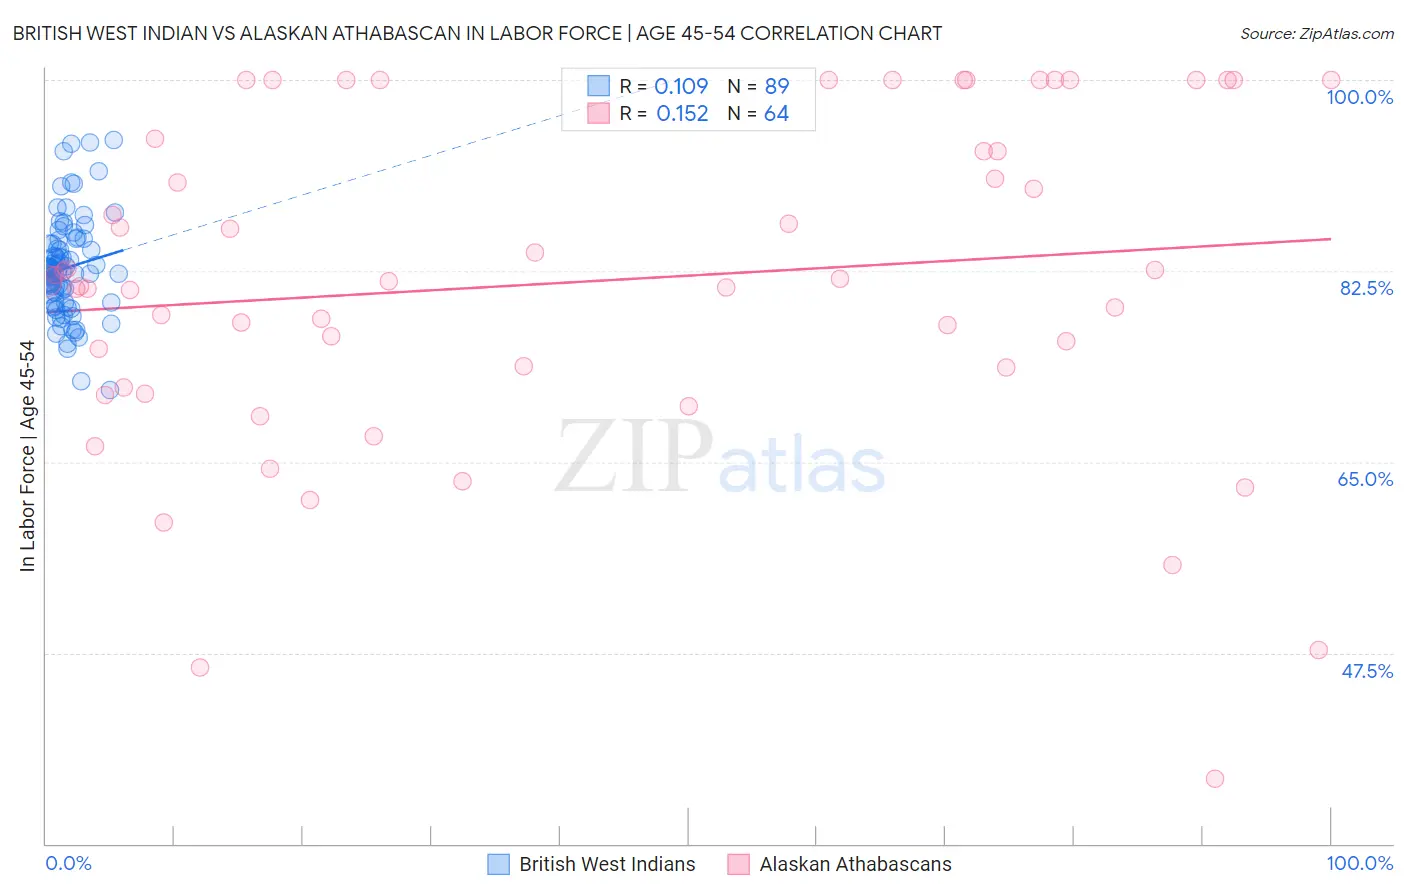
British West Indian vs Alaskan Athabascan In Labor Force | Age 45-54 Correlation Chart
The statistical analysis conducted on geographies consisting of 152,595,623 people shows a poor positive correlation between the proportion of British West Indians and labor force participation rate among population between the ages 45 and 54 in the United States with a correlation coefficient (R) of 0.109 and weighted average of 81.2%. Similarly, the statistical analysis conducted on geographies consisting of 45,818,095 people shows a poor positive correlation between the proportion of Alaskan Athabascans and labor force participation rate among population between the ages 45 and 54 in the United States with a correlation coefficient (R) of 0.152 and weighted average of 81.8%, a difference of 0.64%.
In Labor Force | Age 45-54 Correlation Summary
| Measurement | British West Indian | Alaskan Athabascan |
| Minimum | 71.6% | 36.0% |
| Maximum | 94.5% | 100.0% |
| Range | 22.9% | 64.0% |
| Mean | 82.8% | 81.5% |
| Median | 82.5% | 81.5% |
| Interquartile 25% (IQ1) | 79.7% | 72.8% |
| Interquartile 75% (IQ3) | 85.2% | 94.1% |
| Interquartile Range (IQR) | 5.5% | 21.3% |
| Standard Deviation (Sample) | 4.5% | 15.0% |
| Standard Deviation (Population) | 4.5% | 14.9% |
Similar Demographics by In Labor Force | Age 45-54
Demographics Similar to British West Indians by In Labor Force | Age 45-54
In terms of in labor force | age 45-54, the demographic groups most similar to British West Indians are Nonimmigrants (81.2%, a difference of 0.010%), Chippewa (81.3%, a difference of 0.030%), U.S. Virgin Islander (81.2%, a difference of 0.050%), Guatemalan (81.2%, a difference of 0.070%), and Immigrants from Barbados (81.3%, a difference of 0.10%).
| Demographics | Rating | Rank | In Labor Force | Age 45-54 |
| West Indians | 0.1 /100 | #267 | Tragic 81.4% |
| Immigrants | Honduras | 0.0 /100 | #268 | Tragic 81.4% |
| Alsatians | 0.0 /100 | #269 | Tragic 81.3% |
| Bangladeshis | 0.0 /100 | #270 | Tragic 81.3% |
| Immigrants | Barbados | 0.0 /100 | #271 | Tragic 81.3% |
| Spanish | 0.0 /100 | #272 | Tragic 81.3% |
| Chippewa | 0.0 /100 | #273 | Tragic 81.3% |
| British West Indians | 0.0 /100 | #274 | Tragic 81.2% |
| Immigrants | Nonimmigrants | 0.0 /100 | #275 | Tragic 81.2% |
| U.S. Virgin Islanders | 0.0 /100 | #276 | Tragic 81.2% |
| Guatemalans | 0.0 /100 | #277 | Tragic 81.2% |
| Immigrants | Guatemala | 0.0 /100 | #278 | Tragic 81.1% |
| Immigrants | Micronesia | 0.0 /100 | #279 | Tragic 81.1% |
| Immigrants | Latin America | 0.0 /100 | #280 | Tragic 81.0% |
| Immigrants | Grenada | 0.0 /100 | #281 | Tragic 81.0% |
Demographics Similar to Alaskan Athabascans by In Labor Force | Age 45-54
In terms of in labor force | age 45-54, the demographic groups most similar to Alaskan Athabascans are Alaska Native (81.8%, a difference of 0.010%), Celtic (81.8%, a difference of 0.020%), Central American (81.7%, a difference of 0.020%), Puget Sound Salish (81.7%, a difference of 0.040%), and Hmong (81.7%, a difference of 0.060%).
| Demographics | Rating | Rank | In Labor Force | Age 45-54 |
| Immigrants | Thailand | 1.0 /100 | #239 | Tragic 81.9% |
| Immigrants | El Salvador | 1.0 /100 | #240 | Tragic 81.9% |
| Immigrants | Cambodia | 0.8 /100 | #241 | Tragic 81.9% |
| Whites/Caucasians | 0.7 /100 | #242 | Tragic 81.9% |
| Samoans | 0.6 /100 | #243 | Tragic 81.8% |
| Celtics | 0.4 /100 | #244 | Tragic 81.8% |
| Alaska Natives | 0.4 /100 | #245 | Tragic 81.8% |
| Alaskan Athabascans | 0.4 /100 | #246 | Tragic 81.8% |
| Central Americans | 0.4 /100 | #247 | Tragic 81.7% |
| Puget Sound Salish | 0.3 /100 | #248 | Tragic 81.7% |
| Hmong | 0.3 /100 | #249 | Tragic 81.7% |
| Immigrants | Armenia | 0.2 /100 | #250 | Tragic 81.7% |
| Guamanians/Chamorros | 0.2 /100 | #251 | Tragic 81.6% |
| Pennsylvania Germans | 0.2 /100 | #252 | Tragic 81.6% |
| Japanese | 0.2 /100 | #253 | Tragic 81.6% |