Black/African American vs Immigrants from Guatemala In Labor Force | Age > 16
COMPARE
Black/African American
Immigrants from Guatemala
In Labor Force | Age > 16
In Labor Force | Age > 16 Comparison
Blacks/African Americans
Immigrants from Guatemala
63.4%
IN LABOR FORCE | AGE > 16
0.0/ 100
METRIC RATING
306th/ 347
METRIC RANK
65.6%
IN LABOR FORCE | AGE > 16
94.4/ 100
METRIC RATING
130th/ 347
METRIC RANK
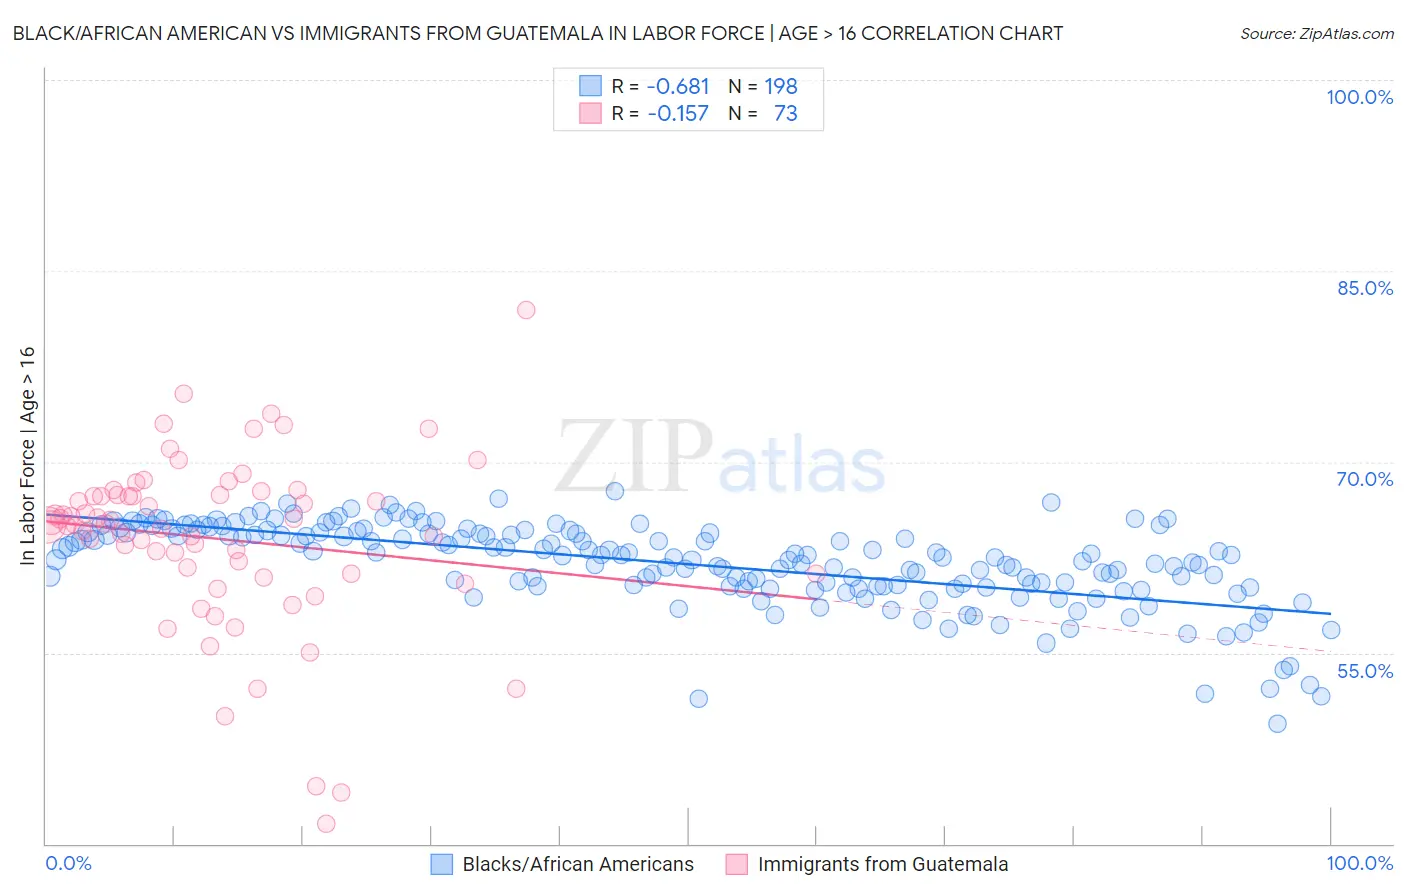
Black/African American vs Immigrants from Guatemala In Labor Force | Age > 16 Correlation Chart
The statistical analysis conducted on geographies consisting of 566,016,902 people shows a significant negative correlation between the proportion of Blacks/African Americans and labor force participation rate among population ages 16 and over in the United States with a correlation coefficient (R) of -0.681 and weighted average of 63.4%. Similarly, the statistical analysis conducted on geographies consisting of 377,275,426 people shows a poor negative correlation between the proportion of Immigrants from Guatemala and labor force participation rate among population ages 16 and over in the United States with a correlation coefficient (R) of -0.157 and weighted average of 65.6%, a difference of 3.5%.
In Labor Force | Age > 16 Correlation Summary
| Measurement | Black/African American | Immigrants from Guatemala |
| Minimum | 49.4% | 41.6% |
| Maximum | 67.7% | 81.9% |
| Range | 18.2% | 40.3% |
| Mean | 62.0% | 64.0% |
| Median | 62.6% | 65.1% |
| Interquartile 25% (IQ1) | 60.2% | 61.2% |
| Interquartile 75% (IQ3) | 64.5% | 67.4% |
| Interquartile Range (IQR) | 4.2% | 6.2% |
| Standard Deviation (Sample) | 3.3% | 6.9% |
| Standard Deviation (Population) | 3.3% | 6.8% |
Similar Demographics by In Labor Force | Age > 16
Demographics Similar to Blacks/African Americans by In Labor Force | Age > 16
In terms of in labor force | age > 16, the demographic groups most similar to Blacks/African Americans are Central American Indian (63.4%, a difference of 0.030%), Pennsylvania German (63.4%, a difference of 0.080%), Osage (63.5%, a difference of 0.090%), Nonimmigrants (63.5%, a difference of 0.14%), and Cree (63.5%, a difference of 0.19%).
| Demographics | Rating | Rank | In Labor Force | Age > 16 |
| Whites/Caucasians | 0.0 /100 | #299 | Tragic 63.6% |
| Immigrants | Azores | 0.0 /100 | #300 | Tragic 63.6% |
| Spanish Americans | 0.0 /100 | #301 | Tragic 63.6% |
| Delaware | 0.0 /100 | #302 | Tragic 63.6% |
| Cree | 0.0 /100 | #303 | Tragic 63.5% |
| Immigrants | Nonimmigrants | 0.0 /100 | #304 | Tragic 63.5% |
| Osage | 0.0 /100 | #305 | Tragic 63.5% |
| Blacks/African Americans | 0.0 /100 | #306 | Tragic 63.4% |
| Central American Indians | 0.0 /100 | #307 | Tragic 63.4% |
| Pennsylvania Germans | 0.0 /100 | #308 | Tragic 63.4% |
| Scotch-Irish | 0.0 /100 | #309 | Tragic 63.3% |
| Shoshone | 0.0 /100 | #310 | Tragic 63.2% |
| Blackfeet | 0.0 /100 | #311 | Tragic 63.2% |
| Iroquois | 0.0 /100 | #312 | Tragic 63.2% |
| Chippewa | 0.0 /100 | #313 | Tragic 63.1% |
Demographics Similar to Immigrants from Guatemala by In Labor Force | Age > 16
In terms of in labor force | age > 16, the demographic groups most similar to Immigrants from Guatemala are Immigrants from Philippines (65.6%, a difference of 0.0%), Icelander (65.6%, a difference of 0.0%), Immigrants from North Macedonia (65.6%, a difference of 0.010%), Ecuadorian (65.6%, a difference of 0.020%), and Immigrants from Eastern Asia (65.7%, a difference of 0.030%).
| Demographics | Rating | Rank | In Labor Force | Age > 16 |
| Immigrants | Iraq | 95.5 /100 | #123 | Exceptional 65.7% |
| Iraqis | 95.4 /100 | #124 | Exceptional 65.7% |
| Norwegians | 95.3 /100 | #125 | Exceptional 65.7% |
| Koreans | 95.3 /100 | #126 | Exceptional 65.7% |
| Immigrants | Eastern Asia | 94.9 /100 | #127 | Exceptional 65.7% |
| Ecuadorians | 94.7 /100 | #128 | Exceptional 65.6% |
| Immigrants | Philippines | 94.5 /100 | #129 | Exceptional 65.6% |
| Immigrants | Guatemala | 94.4 /100 | #130 | Exceptional 65.6% |
| Icelanders | 94.3 /100 | #131 | Exceptional 65.6% |
| Immigrants | North Macedonia | 94.1 /100 | #132 | Exceptional 65.6% |
| Immigrants | Lithuania | 93.5 /100 | #133 | Exceptional 65.6% |
| Costa Ricans | 93.2 /100 | #134 | Exceptional 65.6% |
| Guatemalans | 92.5 /100 | #135 | Exceptional 65.6% |
| Immigrants | Argentina | 92.4 /100 | #136 | Exceptional 65.6% |
| Guamanians/Chamorros | 92.4 /100 | #137 | Exceptional 65.6% |