Black/African American vs Ukrainian In Labor Force | Age > 16
COMPARE
Black/African American
Ukrainian
In Labor Force | Age > 16
In Labor Force | Age > 16 Comparison
Blacks/African Americans
Ukrainians
63.4%
IN LABOR FORCE | AGE > 16
0.0/ 100
METRIC RATING
306th/ 347
METRIC RANK
64.9%
IN LABOR FORCE | AGE > 16
19.6/ 100
METRIC RATING
201st/ 347
METRIC RANK
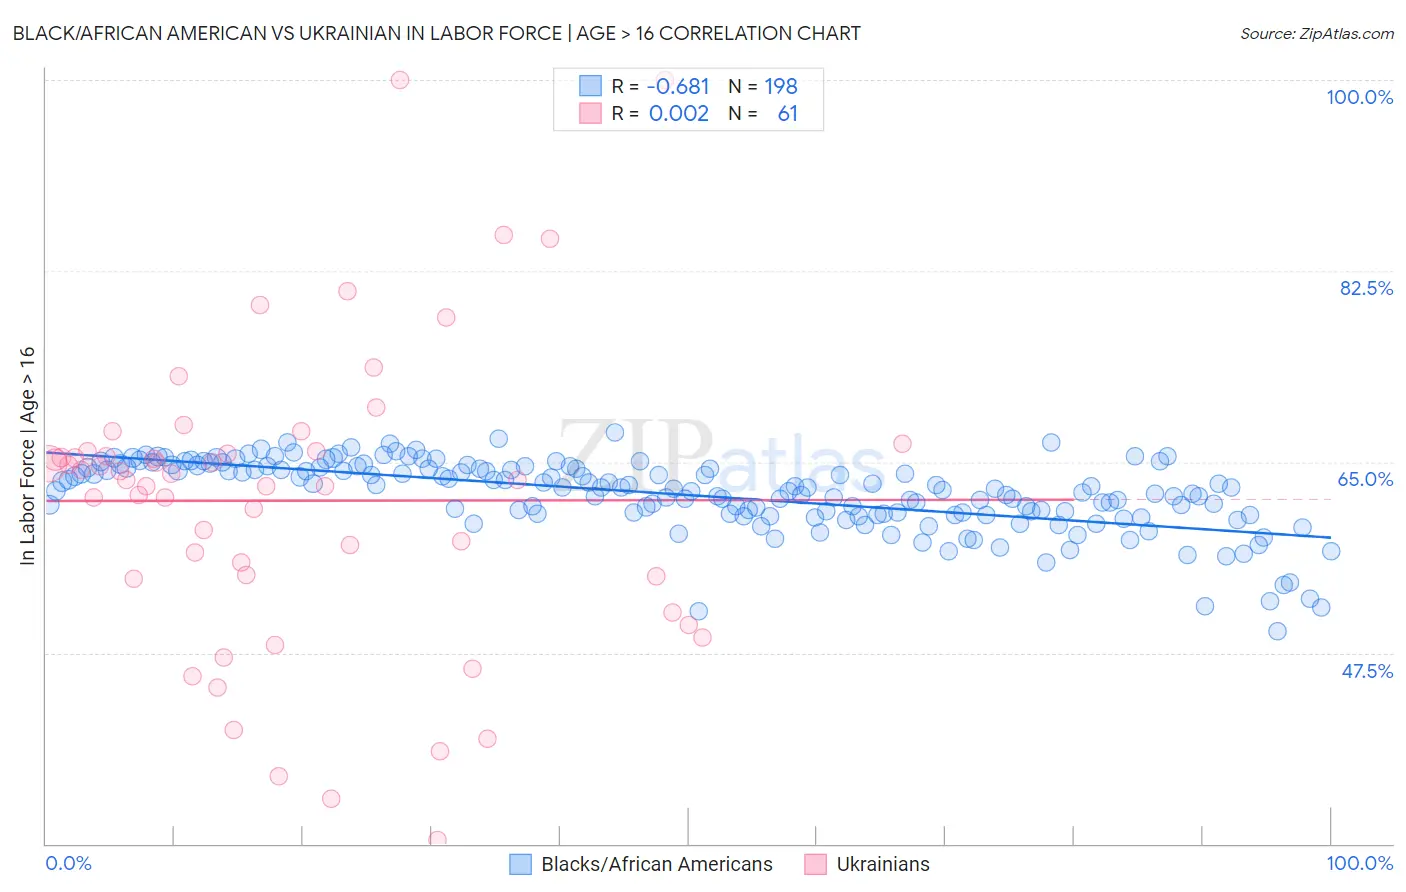
Black/African American vs Ukrainian In Labor Force | Age > 16 Correlation Chart
The statistical analysis conducted on geographies consisting of 566,016,902 people shows a significant negative correlation between the proportion of Blacks/African Americans and labor force participation rate among population ages 16 and over in the United States with a correlation coefficient (R) of -0.681 and weighted average of 63.4%. Similarly, the statistical analysis conducted on geographies consisting of 448,710,826 people shows no correlation between the proportion of Ukrainians and labor force participation rate among population ages 16 and over in the United States with a correlation coefficient (R) of 0.002 and weighted average of 64.9%, a difference of 2.3%.
In Labor Force | Age > 16 Correlation Summary
| Measurement | Black/African American | Ukrainian |
| Minimum | 49.4% | 30.4% |
| Maximum | 67.7% | 100.0% |
| Range | 18.2% | 69.6% |
| Mean | 62.0% | 61.4% |
| Median | 62.6% | 63.4% |
| Interquartile 25% (IQ1) | 60.2% | 54.4% |
| Interquartile 75% (IQ3) | 64.5% | 66.0% |
| Interquartile Range (IQR) | 4.2% | 11.6% |
| Standard Deviation (Sample) | 3.3% | 13.8% |
| Standard Deviation (Population) | 3.3% | 13.7% |
Similar Demographics by In Labor Force | Age > 16
Demographics Similar to Blacks/African Americans by In Labor Force | Age > 16
In terms of in labor force | age > 16, the demographic groups most similar to Blacks/African Americans are Central American Indian (63.4%, a difference of 0.030%), Pennsylvania German (63.4%, a difference of 0.080%), Osage (63.5%, a difference of 0.090%), Nonimmigrants (63.5%, a difference of 0.14%), and Cree (63.5%, a difference of 0.19%).
| Demographics | Rating | Rank | In Labor Force | Age > 16 |
| Whites/Caucasians | 0.0 /100 | #299 | Tragic 63.6% |
| Immigrants | Azores | 0.0 /100 | #300 | Tragic 63.6% |
| Spanish Americans | 0.0 /100 | #301 | Tragic 63.6% |
| Delaware | 0.0 /100 | #302 | Tragic 63.6% |
| Cree | 0.0 /100 | #303 | Tragic 63.5% |
| Immigrants | Nonimmigrants | 0.0 /100 | #304 | Tragic 63.5% |
| Osage | 0.0 /100 | #305 | Tragic 63.5% |
| Blacks/African Americans | 0.0 /100 | #306 | Tragic 63.4% |
| Central American Indians | 0.0 /100 | #307 | Tragic 63.4% |
| Pennsylvania Germans | 0.0 /100 | #308 | Tragic 63.4% |
| Scotch-Irish | 0.0 /100 | #309 | Tragic 63.3% |
| Shoshone | 0.0 /100 | #310 | Tragic 63.2% |
| Blackfeet | 0.0 /100 | #311 | Tragic 63.2% |
| Iroquois | 0.0 /100 | #312 | Tragic 63.2% |
| Chippewa | 0.0 /100 | #313 | Tragic 63.1% |
Demographics Similar to Ukrainians by In Labor Force | Age > 16
In terms of in labor force | age > 16, the demographic groups most similar to Ukrainians are Immigrants from Belgium (64.9%, a difference of 0.0%), Armenian (64.9%, a difference of 0.010%), Russian (64.9%, a difference of 0.010%), Slovene (64.9%, a difference of 0.020%), and Jamaican (64.9%, a difference of 0.020%).
| Demographics | Rating | Rank | In Labor Force | Age > 16 |
| Immigrants | Southern Europe | 31.3 /100 | #194 | Fair 65.0% |
| Romanians | 31.1 /100 | #195 | Fair 65.0% |
| Haitians | 30.6 /100 | #196 | Fair 65.0% |
| Immigrants | Italy | 28.7 /100 | #197 | Fair 65.0% |
| Greeks | 26.1 /100 | #198 | Fair 64.9% |
| Mexican American Indians | 23.1 /100 | #199 | Fair 64.9% |
| Armenians | 20.2 /100 | #200 | Fair 64.9% |
| Ukrainians | 19.6 /100 | #201 | Poor 64.9% |
| Immigrants | Belgium | 19.4 /100 | #202 | Poor 64.9% |
| Russians | 18.8 /100 | #203 | Poor 64.9% |
| Slovenes | 18.7 /100 | #204 | Poor 64.9% |
| Jamaicans | 18.7 /100 | #205 | Poor 64.9% |
| Lithuanians | 17.4 /100 | #206 | Poor 64.8% |
| Immigrants | Latin America | 16.4 /100 | #207 | Poor 64.8% |
| Belizeans | 16.2 /100 | #208 | Poor 64.8% |