Black/African American vs Bangladeshi In Labor Force | Age > 16
COMPARE
Black/African American
Bangladeshi
In Labor Force | Age > 16
In Labor Force | Age > 16 Comparison
Blacks/African Americans
Bangladeshis
63.4%
IN LABOR FORCE | AGE > 16
0.0/ 100
METRIC RATING
306th/ 347
METRIC RANK
65.9%
IN LABOR FORCE | AGE > 16
98.9/ 100
METRIC RATING
96th/ 347
METRIC RANK
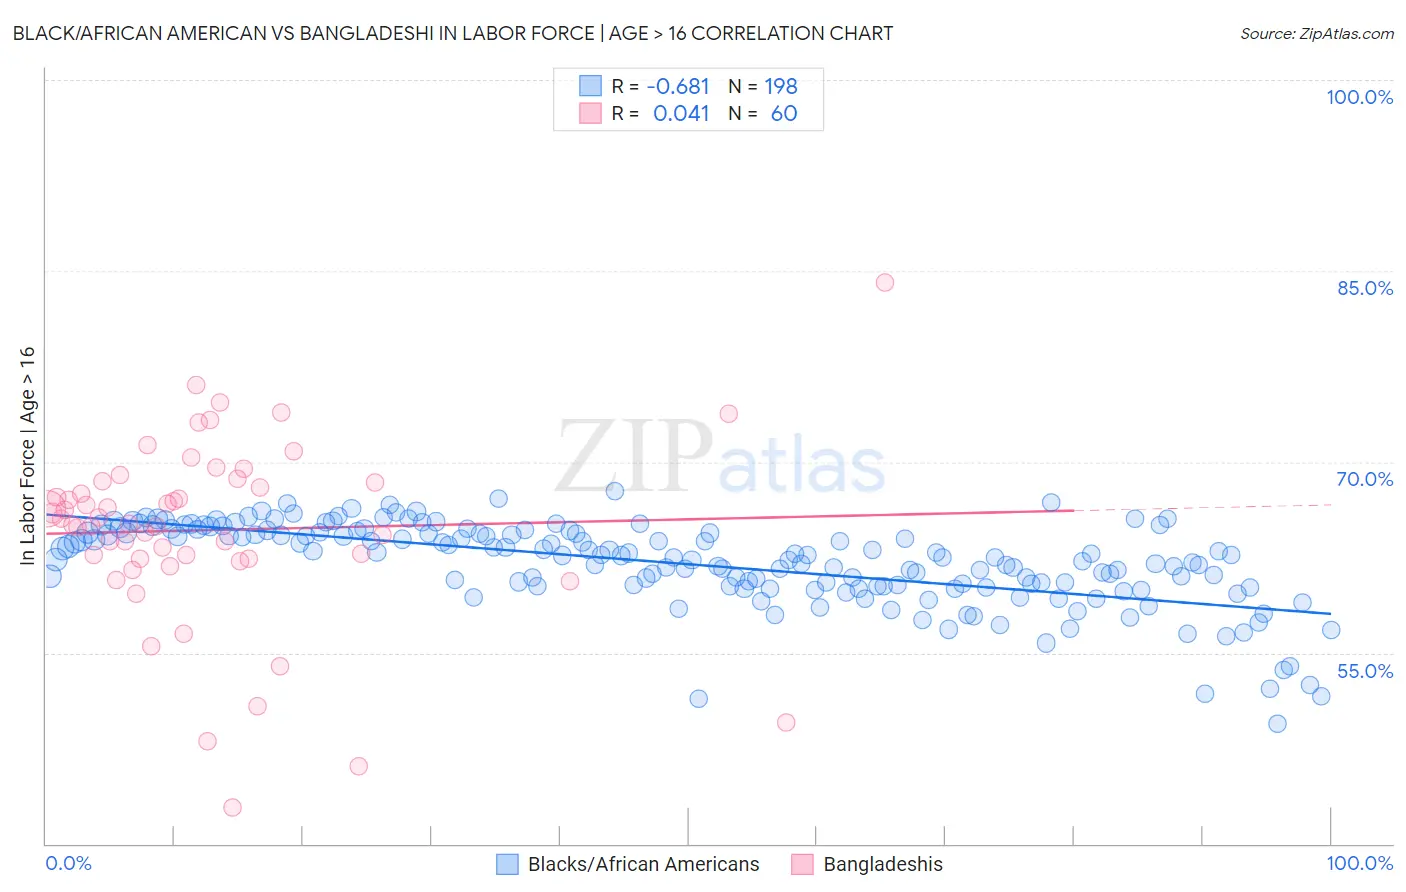
Black/African American vs Bangladeshi In Labor Force | Age > 16 Correlation Chart
The statistical analysis conducted on geographies consisting of 566,016,902 people shows a significant negative correlation between the proportion of Blacks/African Americans and labor force participation rate among population ages 16 and over in the United States with a correlation coefficient (R) of -0.681 and weighted average of 63.4%. Similarly, the statistical analysis conducted on geographies consisting of 141,452,926 people shows no correlation between the proportion of Bangladeshis and labor force participation rate among population ages 16 and over in the United States with a correlation coefficient (R) of 0.041 and weighted average of 65.9%, a difference of 4.0%.
In Labor Force | Age > 16 Correlation Summary
| Measurement | Black/African American | Bangladeshi |
| Minimum | 49.4% | 42.8% |
| Maximum | 67.7% | 84.1% |
| Range | 18.2% | 41.3% |
| Mean | 62.0% | 64.7% |
| Median | 62.6% | 65.3% |
| Interquartile 25% (IQ1) | 60.2% | 62.4% |
| Interquartile 75% (IQ3) | 64.5% | 68.4% |
| Interquartile Range (IQR) | 4.2% | 6.0% |
| Standard Deviation (Sample) | 3.3% | 7.3% |
| Standard Deviation (Population) | 3.3% | 7.2% |
Similar Demographics by In Labor Force | Age > 16
Demographics Similar to Blacks/African Americans by In Labor Force | Age > 16
In terms of in labor force | age > 16, the demographic groups most similar to Blacks/African Americans are Central American Indian (63.4%, a difference of 0.030%), Pennsylvania German (63.4%, a difference of 0.080%), Osage (63.5%, a difference of 0.090%), Nonimmigrants (63.5%, a difference of 0.14%), and Cree (63.5%, a difference of 0.19%).
| Demographics | Rating | Rank | In Labor Force | Age > 16 |
| Whites/Caucasians | 0.0 /100 | #299 | Tragic 63.6% |
| Immigrants | Azores | 0.0 /100 | #300 | Tragic 63.6% |
| Spanish Americans | 0.0 /100 | #301 | Tragic 63.6% |
| Delaware | 0.0 /100 | #302 | Tragic 63.6% |
| Cree | 0.0 /100 | #303 | Tragic 63.5% |
| Immigrants | Nonimmigrants | 0.0 /100 | #304 | Tragic 63.5% |
| Osage | 0.0 /100 | #305 | Tragic 63.5% |
| Blacks/African Americans | 0.0 /100 | #306 | Tragic 63.4% |
| Central American Indians | 0.0 /100 | #307 | Tragic 63.4% |
| Pennsylvania Germans | 0.0 /100 | #308 | Tragic 63.4% |
| Scotch-Irish | 0.0 /100 | #309 | Tragic 63.3% |
| Shoshone | 0.0 /100 | #310 | Tragic 63.2% |
| Blackfeet | 0.0 /100 | #311 | Tragic 63.2% |
| Iroquois | 0.0 /100 | #312 | Tragic 63.2% |
| Chippewa | 0.0 /100 | #313 | Tragic 63.1% |
Demographics Similar to Bangladeshis by In Labor Force | Age > 16
In terms of in labor force | age > 16, the demographic groups most similar to Bangladeshis are Filipino (65.9%, a difference of 0.010%), Immigrants from Uruguay (66.0%, a difference of 0.040%), Immigrants from Chile (65.9%, a difference of 0.040%), Immigrants from Cambodia (66.0%, a difference of 0.050%), and Immigrants from South America (66.0%, a difference of 0.060%).
| Demographics | Rating | Rank | In Labor Force | Age > 16 |
| Immigrants | Laos | 99.2 /100 | #89 | Exceptional 66.0% |
| Chileans | 99.2 /100 | #90 | Exceptional 66.0% |
| Iranians | 99.2 /100 | #91 | Exceptional 66.0% |
| Aleuts | 99.1 /100 | #92 | Exceptional 66.0% |
| Immigrants | South America | 99.1 /100 | #93 | Exceptional 66.0% |
| Immigrants | Cambodia | 99.1 /100 | #94 | Exceptional 66.0% |
| Immigrants | Uruguay | 99.1 /100 | #95 | Exceptional 66.0% |
| Bangladeshis | 98.9 /100 | #96 | Exceptional 65.9% |
| Filipinos | 98.9 /100 | #97 | Exceptional 65.9% |
| Immigrants | Chile | 98.7 /100 | #98 | Exceptional 65.9% |
| Immigrants | Australia | 98.7 /100 | #99 | Exceptional 65.9% |
| Okinawans | 98.7 /100 | #100 | Exceptional 65.9% |
| Immigrants | Colombia | 98.6 /100 | #101 | Exceptional 65.9% |
| Uruguayans | 98.6 /100 | #102 | Exceptional 65.9% |
| Immigrants | South Eastern Asia | 98.5 /100 | #103 | Exceptional 65.9% |