Immigrants from Venezuela vs Immigrants from Guatemala In Labor Force | Age > 16
COMPARE
Immigrants from Venezuela
Immigrants from Guatemala
In Labor Force | Age > 16
In Labor Force | Age > 16 Comparison
Immigrants from Venezuela
Immigrants from Guatemala
66.4%
IN LABOR FORCE | AGE > 16
99.9/ 100
METRIC RATING
55th/ 347
METRIC RANK
65.6%
IN LABOR FORCE | AGE > 16
94.4/ 100
METRIC RATING
130th/ 347
METRIC RANK
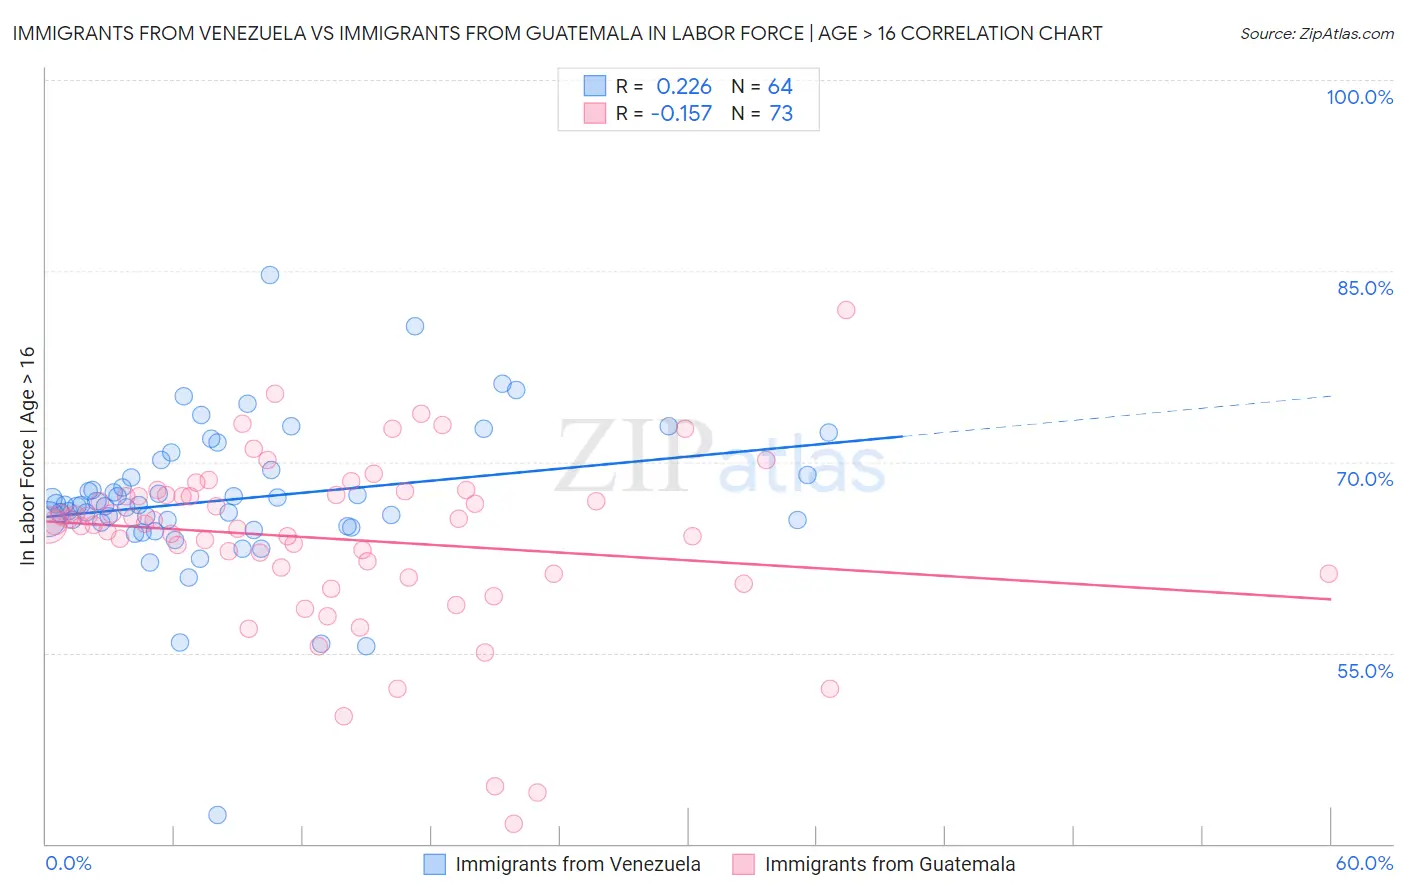
Immigrants from Venezuela vs Immigrants from Guatemala In Labor Force | Age > 16 Correlation Chart
The statistical analysis conducted on geographies consisting of 287,871,143 people shows a weak positive correlation between the proportion of Immigrants from Venezuela and labor force participation rate among population ages 16 and over in the United States with a correlation coefficient (R) of 0.226 and weighted average of 66.4%. Similarly, the statistical analysis conducted on geographies consisting of 377,275,426 people shows a poor negative correlation between the proportion of Immigrants from Guatemala and labor force participation rate among population ages 16 and over in the United States with a correlation coefficient (R) of -0.157 and weighted average of 65.6%, a difference of 1.2%.
In Labor Force | Age > 16 Correlation Summary
| Measurement | Immigrants from Venezuela | Immigrants from Guatemala |
| Minimum | 42.3% | 41.6% |
| Maximum | 84.7% | 81.9% |
| Range | 42.4% | 40.3% |
| Mean | 67.1% | 64.0% |
| Median | 66.6% | 65.1% |
| Interquartile 25% (IQ1) | 65.1% | 61.2% |
| Interquartile 75% (IQ3) | 69.2% | 67.4% |
| Interquartile Range (IQR) | 4.1% | 6.2% |
| Standard Deviation (Sample) | 5.9% | 6.9% |
| Standard Deviation (Population) | 5.9% | 6.8% |
Similar Demographics by In Labor Force | Age > 16
Demographics Similar to Immigrants from Venezuela by In Labor Force | Age > 16
In terms of in labor force | age > 16, the demographic groups most similar to Immigrants from Venezuela are Immigrants from Senegal (66.4%, a difference of 0.030%), Bulgarian (66.4%, a difference of 0.040%), Immigrants from Bosnia and Herzegovina (66.5%, a difference of 0.050%), Immigrants from Sri Lanka (66.5%, a difference of 0.080%), and Paraguayan (66.5%, a difference of 0.10%).
| Demographics | Rating | Rank | In Labor Force | Age > 16 |
| Nigerians | 100.0 /100 | #48 | Exceptional 66.6% |
| Immigrants | Northern Africa | 100.0 /100 | #49 | Exceptional 66.6% |
| Cape Verdeans | 100.0 /100 | #50 | Exceptional 66.6% |
| Immigrants | Kuwait | 100.0 /100 | #51 | Exceptional 66.5% |
| Paraguayans | 99.9 /100 | #52 | Exceptional 66.5% |
| Immigrants | Sri Lanka | 99.9 /100 | #53 | Exceptional 66.5% |
| Immigrants | Bosnia and Herzegovina | 99.9 /100 | #54 | Exceptional 66.5% |
| Immigrants | Venezuela | 99.9 /100 | #55 | Exceptional 66.4% |
| Immigrants | Senegal | 99.9 /100 | #56 | Exceptional 66.4% |
| Bulgarians | 99.9 /100 | #57 | Exceptional 66.4% |
| Immigrants | Saudi Arabia | 99.9 /100 | #58 | Exceptional 66.3% |
| Immigrants | Turkey | 99.9 /100 | #59 | Exceptional 66.3% |
| Immigrants | Peru | 99.8 /100 | #60 | Exceptional 66.3% |
| Immigrants | Burma/Myanmar | 99.8 /100 | #61 | Exceptional 66.3% |
| Indonesians | 99.8 /100 | #62 | Exceptional 66.3% |
Demographics Similar to Immigrants from Guatemala by In Labor Force | Age > 16
In terms of in labor force | age > 16, the demographic groups most similar to Immigrants from Guatemala are Immigrants from Philippines (65.6%, a difference of 0.0%), Icelander (65.6%, a difference of 0.0%), Immigrants from North Macedonia (65.6%, a difference of 0.010%), Ecuadorian (65.6%, a difference of 0.020%), and Immigrants from Eastern Asia (65.7%, a difference of 0.030%).
| Demographics | Rating | Rank | In Labor Force | Age > 16 |
| Immigrants | Iraq | 95.5 /100 | #123 | Exceptional 65.7% |
| Iraqis | 95.4 /100 | #124 | Exceptional 65.7% |
| Norwegians | 95.3 /100 | #125 | Exceptional 65.7% |
| Koreans | 95.3 /100 | #126 | Exceptional 65.7% |
| Immigrants | Eastern Asia | 94.9 /100 | #127 | Exceptional 65.7% |
| Ecuadorians | 94.7 /100 | #128 | Exceptional 65.6% |
| Immigrants | Philippines | 94.5 /100 | #129 | Exceptional 65.6% |
| Immigrants | Guatemala | 94.4 /100 | #130 | Exceptional 65.6% |
| Icelanders | 94.3 /100 | #131 | Exceptional 65.6% |
| Immigrants | North Macedonia | 94.1 /100 | #132 | Exceptional 65.6% |
| Immigrants | Lithuania | 93.5 /100 | #133 | Exceptional 65.6% |
| Costa Ricans | 93.2 /100 | #134 | Exceptional 65.6% |
| Guatemalans | 92.5 /100 | #135 | Exceptional 65.6% |
| Immigrants | Argentina | 92.4 /100 | #136 | Exceptional 65.6% |
| Guamanians/Chamorros | 92.4 /100 | #137 | Exceptional 65.6% |