Immigrants from Ireland vs Immigrants from Guatemala In Labor Force | Age > 16
COMPARE
Immigrants from Ireland
Immigrants from Guatemala
In Labor Force | Age > 16
In Labor Force | Age > 16 Comparison
Immigrants from Ireland
Immigrants from Guatemala
65.3%
IN LABOR FORCE | AGE > 16
75.9/ 100
METRIC RATING
156th/ 347
METRIC RANK
65.6%
IN LABOR FORCE | AGE > 16
94.4/ 100
METRIC RATING
130th/ 347
METRIC RANK
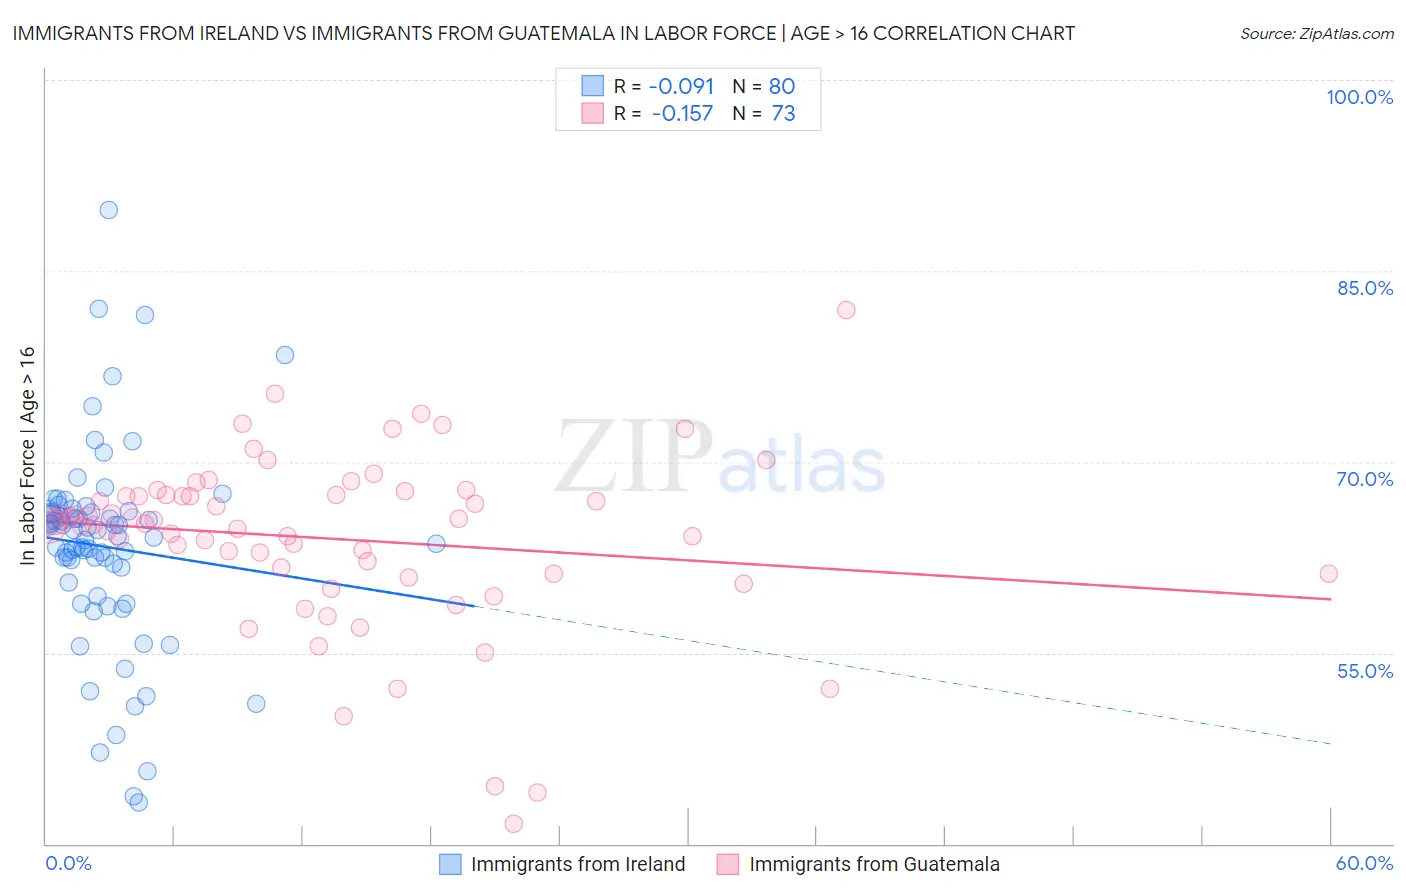
Immigrants from Ireland vs Immigrants from Guatemala In Labor Force | Age > 16 Correlation Chart
The statistical analysis conducted on geographies consisting of 240,784,168 people shows a slight negative correlation between the proportion of Immigrants from Ireland and labor force participation rate among population ages 16 and over in the United States with a correlation coefficient (R) of -0.091 and weighted average of 65.3%. Similarly, the statistical analysis conducted on geographies consisting of 377,275,426 people shows a poor negative correlation between the proportion of Immigrants from Guatemala and labor force participation rate among population ages 16 and over in the United States with a correlation coefficient (R) of -0.157 and weighted average of 65.6%, a difference of 0.47%.
In Labor Force | Age > 16 Correlation Summary
| Measurement | Immigrants from Ireland | Immigrants from Guatemala |
| Minimum | 43.2% | 41.6% |
| Maximum | 89.8% | 81.9% |
| Range | 46.6% | 40.3% |
| Mean | 63.3% | 64.0% |
| Median | 64.4% | 65.1% |
| Interquartile 25% (IQ1) | 61.1% | 61.2% |
| Interquartile 75% (IQ3) | 66.0% | 67.4% |
| Interquartile Range (IQR) | 4.9% | 6.2% |
| Standard Deviation (Sample) | 7.9% | 6.9% |
| Standard Deviation (Population) | 7.8% | 6.8% |
Similar Demographics by In Labor Force | Age > 16
Demographics Similar to Immigrants from Ireland by In Labor Force | Age > 16
In terms of in labor force | age > 16, the demographic groups most similar to Immigrants from Ireland are Immigrants from Russia (65.3%, a difference of 0.0%), Immigrants from Armenia (65.3%, a difference of 0.010%), Panamanian (65.3%, a difference of 0.010%), Immigrants from Syria (65.3%, a difference of 0.020%), and Immigrants from Eastern Europe (65.4%, a difference of 0.040%).
| Demographics | Rating | Rank | In Labor Force | Age > 16 |
| Immigrants | Albania | 85.7 /100 | #149 | Excellent 65.4% |
| Immigrants | Immigrants | 81.9 /100 | #150 | Excellent 65.4% |
| Czechs | 81.5 /100 | #151 | Excellent 65.4% |
| Yugoslavians | 81.3 /100 | #152 | Excellent 65.4% |
| Immigrants | China | 80.5 /100 | #153 | Excellent 65.4% |
| Immigrants | Eastern Europe | 78.3 /100 | #154 | Good 65.4% |
| Immigrants | Armenia | 76.6 /100 | #155 | Good 65.3% |
| Immigrants | Ireland | 75.9 /100 | #156 | Good 65.3% |
| Immigrants | Russia | 75.7 /100 | #157 | Good 65.3% |
| Panamanians | 75.2 /100 | #158 | Good 65.3% |
| Immigrants | Syria | 74.6 /100 | #159 | Good 65.3% |
| Immigrants | South Africa | 73.5 /100 | #160 | Good 65.3% |
| Australians | 71.3 /100 | #161 | Good 65.3% |
| Albanians | 70.8 /100 | #162 | Good 65.3% |
| South Africans | 69.8 /100 | #163 | Good 65.3% |
Demographics Similar to Immigrants from Guatemala by In Labor Force | Age > 16
In terms of in labor force | age > 16, the demographic groups most similar to Immigrants from Guatemala are Immigrants from Philippines (65.6%, a difference of 0.0%), Icelander (65.6%, a difference of 0.0%), Immigrants from North Macedonia (65.6%, a difference of 0.010%), Ecuadorian (65.6%, a difference of 0.020%), and Immigrants from Eastern Asia (65.7%, a difference of 0.030%).
| Demographics | Rating | Rank | In Labor Force | Age > 16 |
| Immigrants | Iraq | 95.5 /100 | #123 | Exceptional 65.7% |
| Iraqis | 95.4 /100 | #124 | Exceptional 65.7% |
| Norwegians | 95.3 /100 | #125 | Exceptional 65.7% |
| Koreans | 95.3 /100 | #126 | Exceptional 65.7% |
| Immigrants | Eastern Asia | 94.9 /100 | #127 | Exceptional 65.7% |
| Ecuadorians | 94.7 /100 | #128 | Exceptional 65.6% |
| Immigrants | Philippines | 94.5 /100 | #129 | Exceptional 65.6% |
| Immigrants | Guatemala | 94.4 /100 | #130 | Exceptional 65.6% |
| Icelanders | 94.3 /100 | #131 | Exceptional 65.6% |
| Immigrants | North Macedonia | 94.1 /100 | #132 | Exceptional 65.6% |
| Immigrants | Lithuania | 93.5 /100 | #133 | Exceptional 65.6% |
| Costa Ricans | 93.2 /100 | #134 | Exceptional 65.6% |
| Guatemalans | 92.5 /100 | #135 | Exceptional 65.6% |
| Immigrants | Argentina | 92.4 /100 | #136 | Exceptional 65.6% |
| Guamanians/Chamorros | 92.4 /100 | #137 | Exceptional 65.6% |