Black/African American vs Immigrants from Cameroon In Labor Force | Age 20-64
COMPARE
Black/African American
Immigrants from Cameroon
In Labor Force | Age 20-64
In Labor Force | Age 20-64 Comparison
Blacks/African Americans
Immigrants from Cameroon
76.8%
IN LABOR FORCE | AGE 20-64
0.0/ 100
METRIC RATING
314th/ 347
METRIC RANK
81.6%
IN LABOR FORCE | AGE 20-64
100.0/ 100
METRIC RATING
7th/ 347
METRIC RANK
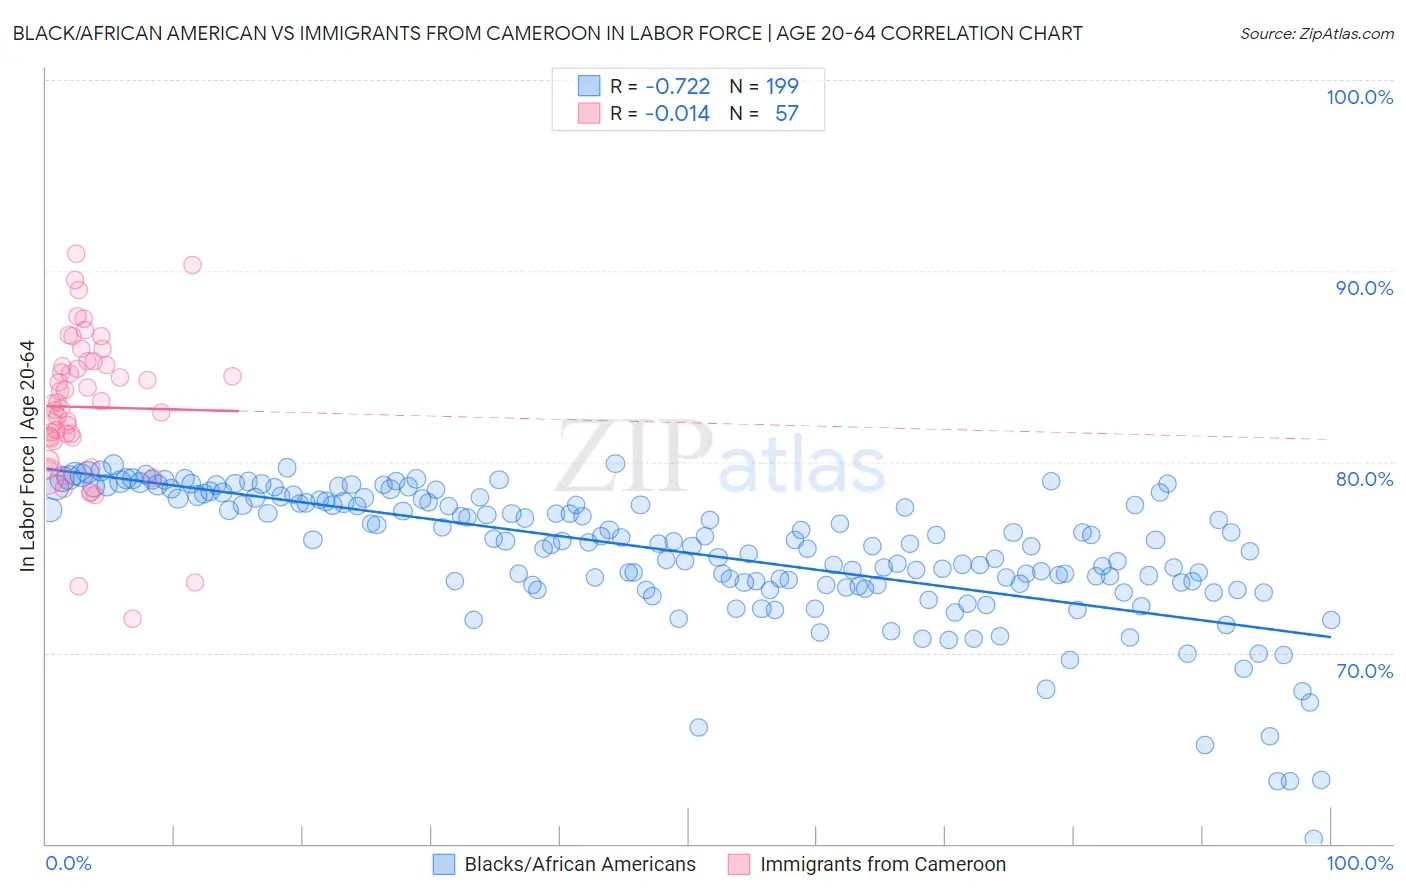
Black/African American vs Immigrants from Cameroon In Labor Force | Age 20-64 Correlation Chart
The statistical analysis conducted on geographies consisting of 566,027,393 people shows a strong negative correlation between the proportion of Blacks/African Americans and labor force participation rate among population between the ages 20 and 64 in the United States with a correlation coefficient (R) of -0.722 and weighted average of 76.8%. Similarly, the statistical analysis conducted on geographies consisting of 130,760,472 people shows no correlation between the proportion of Immigrants from Cameroon and labor force participation rate among population between the ages 20 and 64 in the United States with a correlation coefficient (R) of -0.014 and weighted average of 81.6%, a difference of 6.3%.
In Labor Force | Age 20-64 Correlation Summary
| Measurement | Black/African American | Immigrants from Cameroon |
| Minimum | 60.2% | 71.8% |
| Maximum | 79.9% | 90.9% |
| Range | 19.7% | 19.1% |
| Mean | 75.3% | 82.9% |
| Median | 75.9% | 83.1% |
| Interquartile 25% (IQ1) | 73.6% | 81.2% |
| Interquartile 75% (IQ3) | 78.1% | 85.2% |
| Interquartile Range (IQR) | 4.5% | 4.0% |
| Standard Deviation (Sample) | 3.5% | 3.8% |
| Standard Deviation (Population) | 3.5% | 3.8% |
Similar Demographics by In Labor Force | Age 20-64
Demographics Similar to Blacks/African Americans by In Labor Force | Age 20-64
In terms of in labor force | age 20-64, the demographic groups most similar to Blacks/African Americans are Shoshone (76.8%, a difference of 0.020%), Ottawa (76.7%, a difference of 0.10%), Alaskan Athabascan (76.9%, a difference of 0.14%), Yaqui (76.5%, a difference of 0.29%), and Blackfeet (77.0%, a difference of 0.31%).
| Demographics | Rating | Rank | In Labor Force | Age 20-64 |
| Central American Indians | 0.0 /100 | #307 | Tragic 77.1% |
| Alaska Natives | 0.0 /100 | #308 | Tragic 77.0% |
| Americans | 0.0 /100 | #309 | Tragic 77.0% |
| Comanche | 0.0 /100 | #310 | Tragic 77.0% |
| Blackfeet | 0.0 /100 | #311 | Tragic 77.0% |
| Alaskan Athabascans | 0.0 /100 | #312 | Tragic 76.9% |
| Shoshone | 0.0 /100 | #313 | Tragic 76.8% |
| Blacks/African Americans | 0.0 /100 | #314 | Tragic 76.8% |
| Ottawa | 0.0 /100 | #315 | Tragic 76.7% |
| Yaqui | 0.0 /100 | #316 | Tragic 76.5% |
| Cherokee | 0.0 /100 | #317 | Tragic 76.2% |
| Chickasaw | 0.0 /100 | #318 | Tragic 76.2% |
| Inupiat | 0.0 /100 | #319 | Tragic 76.1% |
| Yakama | 0.0 /100 | #320 | Tragic 75.8% |
| Seminole | 0.0 /100 | #321 | Tragic 75.5% |
Demographics Similar to Immigrants from Cameroon by In Labor Force | Age 20-64
In terms of in labor force | age 20-64, the demographic groups most similar to Immigrants from Cameroon are Immigrants from Somalia (81.6%, a difference of 0.020%), Sierra Leonean (81.5%, a difference of 0.020%), Somali (81.6%, a difference of 0.040%), Immigrants from Sierra Leone (81.5%, a difference of 0.14%), and Bolivian (81.7%, a difference of 0.15%).
| Demographics | Rating | Rank | In Labor Force | Age 20-64 |
| Immigrants | Ethiopia | 100.0 /100 | #1 | Exceptional 82.1% |
| Ethiopians | 100.0 /100 | #2 | Exceptional 82.0% |
| Immigrants | Bolivia | 100.0 /100 | #3 | Exceptional 81.9% |
| Luxembourgers | 100.0 /100 | #4 | Exceptional 81.9% |
| Bolivians | 100.0 /100 | #5 | Exceptional 81.7% |
| Somalis | 100.0 /100 | #6 | Exceptional 81.6% |
| Immigrants | Cameroon | 100.0 /100 | #7 | Exceptional 81.6% |
| Immigrants | Somalia | 100.0 /100 | #8 | Exceptional 81.6% |
| Sierra Leoneans | 100.0 /100 | #9 | Exceptional 81.5% |
| Immigrants | Sierra Leone | 100.0 /100 | #10 | Exceptional 81.5% |
| Immigrants | Eastern Africa | 100.0 /100 | #11 | Exceptional 81.3% |
| Immigrants | Eritrea | 100.0 /100 | #12 | Exceptional 81.3% |
| Immigrants | India | 100.0 /100 | #13 | Exceptional 81.3% |
| Cambodians | 100.0 /100 | #14 | Exceptional 81.1% |
| Bulgarians | 100.0 /100 | #15 | Exceptional 81.1% |