Blackfeet vs Immigrants from Barbados In Labor Force | Age > 16
COMPARE
Blackfeet
Immigrants from Barbados
In Labor Force | Age > 16
In Labor Force | Age > 16 Comparison
Blackfeet
Immigrants from Barbados
63.2%
IN LABOR FORCE | AGE > 16
0.0/ 100
METRIC RATING
311th/ 347
METRIC RANK
64.4%
IN LABOR FORCE | AGE > 16
2.1/ 100
METRIC RATING
248th/ 347
METRIC RANK
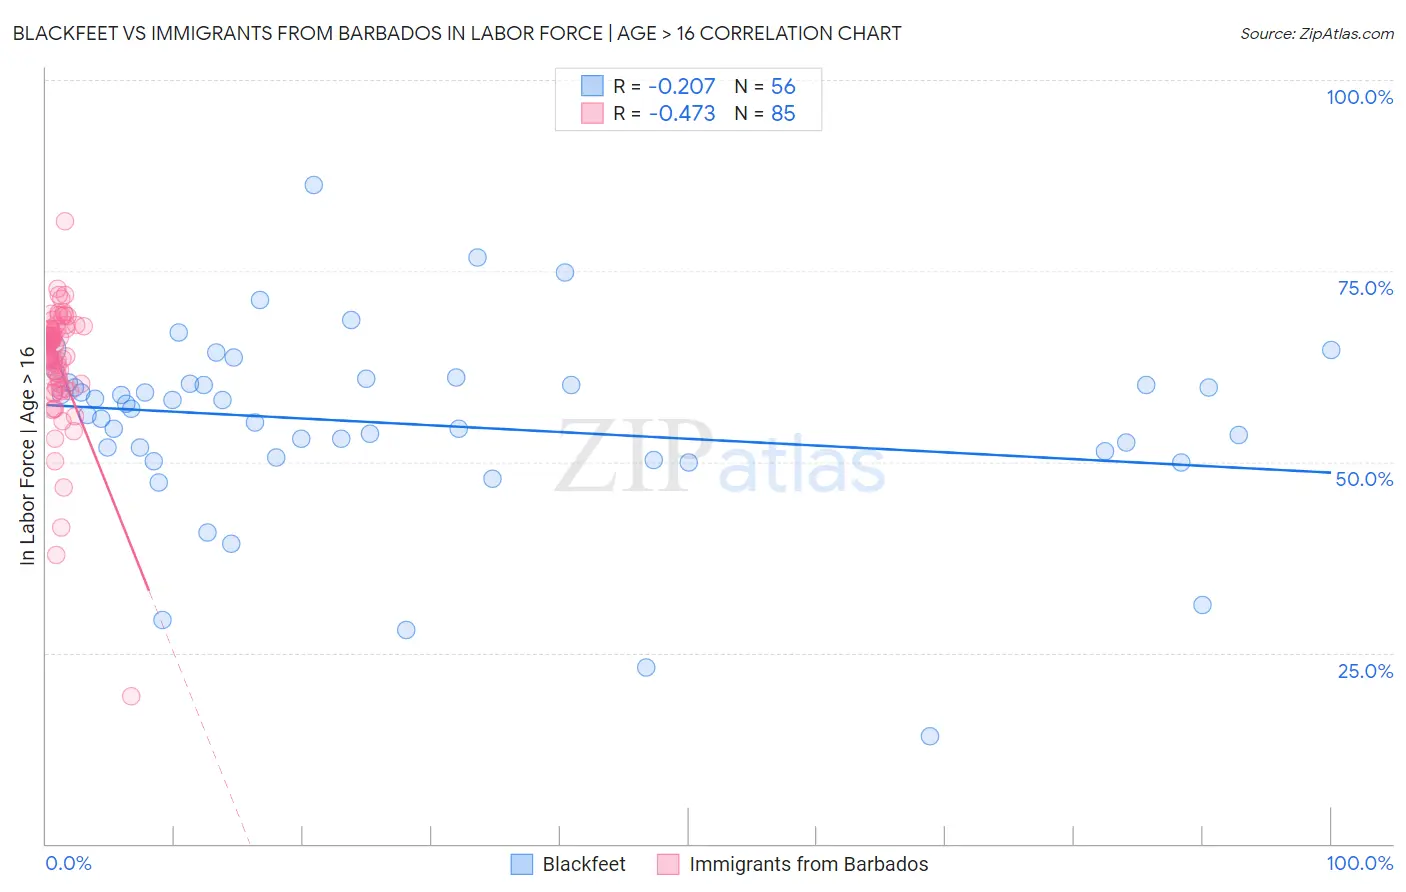
Blackfeet vs Immigrants from Barbados In Labor Force | Age > 16 Correlation Chart
The statistical analysis conducted on geographies consisting of 309,565,086 people shows a weak negative correlation between the proportion of Blackfeet and labor force participation rate among population ages 16 and over in the United States with a correlation coefficient (R) of -0.207 and weighted average of 63.2%. Similarly, the statistical analysis conducted on geographies consisting of 112,778,506 people shows a moderate negative correlation between the proportion of Immigrants from Barbados and labor force participation rate among population ages 16 and over in the United States with a correlation coefficient (R) of -0.473 and weighted average of 64.4%, a difference of 1.9%.
In Labor Force | Age > 16 Correlation Summary
| Measurement | Blackfeet | Immigrants from Barbados |
| Minimum | 14.1% | 19.3% |
| Maximum | 86.2% | 81.5% |
| Range | 72.1% | 62.2% |
| Mean | 55.0% | 63.2% |
| Median | 57.3% | 65.5% |
| Interquartile 25% (IQ1) | 51.0% | 60.6% |
| Interquartile 75% (IQ3) | 60.3% | 67.3% |
| Interquartile Range (IQR) | 9.3% | 6.7% |
| Standard Deviation (Sample) | 12.5% | 8.0% |
| Standard Deviation (Population) | 12.4% | 7.9% |
Similar Demographics by In Labor Force | Age > 16
Demographics Similar to Blackfeet by In Labor Force | Age > 16
In terms of in labor force | age > 16, the demographic groups most similar to Blackfeet are Shoshone (63.2%, a difference of 0.010%), Iroquois (63.2%, a difference of 0.060%), Scotch-Irish (63.3%, a difference of 0.080%), Chippewa (63.1%, a difference of 0.19%), and Pennsylvania German (63.4%, a difference of 0.21%).
| Demographics | Rating | Rank | In Labor Force | Age > 16 |
| Immigrants | Nonimmigrants | 0.0 /100 | #304 | Tragic 63.5% |
| Osage | 0.0 /100 | #305 | Tragic 63.5% |
| Blacks/African Americans | 0.0 /100 | #306 | Tragic 63.4% |
| Central American Indians | 0.0 /100 | #307 | Tragic 63.4% |
| Pennsylvania Germans | 0.0 /100 | #308 | Tragic 63.4% |
| Scotch-Irish | 0.0 /100 | #309 | Tragic 63.3% |
| Shoshone | 0.0 /100 | #310 | Tragic 63.2% |
| Blackfeet | 0.0 /100 | #311 | Tragic 63.2% |
| Iroquois | 0.0 /100 | #312 | Tragic 63.2% |
| Chippewa | 0.0 /100 | #313 | Tragic 63.1% |
| Yaqui | 0.0 /100 | #314 | Tragic 63.0% |
| Potawatomi | 0.0 /100 | #315 | Tragic 62.8% |
| Yup'ik | 0.0 /100 | #316 | Tragic 62.7% |
| Kiowa | 0.0 /100 | #317 | Tragic 62.4% |
| Chickasaw | 0.0 /100 | #318 | Tragic 62.3% |
Demographics Similar to Immigrants from Barbados by In Labor Force | Age > 16
In terms of in labor force | age > 16, the demographic groups most similar to Immigrants from Barbados are Swiss (64.4%, a difference of 0.010%), Immigrants from Caribbean (64.4%, a difference of 0.030%), German (64.4%, a difference of 0.030%), British West Indian (64.4%, a difference of 0.040%), and Portuguese (64.4%, a difference of 0.060%).
| Demographics | Rating | Rank | In Labor Force | Age > 16 |
| Immigrants | Dominica | 3.5 /100 | #241 | Tragic 64.5% |
| Immigrants | Netherlands | 3.4 /100 | #242 | Tragic 64.5% |
| Immigrants | Lebanon | 3.2 /100 | #243 | Tragic 64.5% |
| Tsimshian | 3.1 /100 | #244 | Tragic 64.5% |
| West Indians | 3.0 /100 | #245 | Tragic 64.5% |
| Immigrants | Caribbean | 2.3 /100 | #246 | Tragic 64.4% |
| Swiss | 2.1 /100 | #247 | Tragic 64.4% |
| Immigrants | Barbados | 2.1 /100 | #248 | Tragic 64.4% |
| Germans | 1.8 /100 | #249 | Tragic 64.4% |
| British West Indians | 1.8 /100 | #250 | Tragic 64.4% |
| Portuguese | 1.6 /100 | #251 | Tragic 64.4% |
| Immigrants | Dominican Republic | 1.5 /100 | #252 | Tragic 64.4% |
| Czechoslovakians | 1.4 /100 | #253 | Tragic 64.3% |
| Immigrants | Uzbekistan | 1.4 /100 | #254 | Tragic 64.3% |
| Hispanics or Latinos | 1.1 /100 | #255 | Tragic 64.3% |