Alaska Native vs Immigrants from Barbados In Labor Force | Age > 16
COMPARE
Alaska Native
Immigrants from Barbados
In Labor Force | Age > 16
In Labor Force | Age > 16 Comparison
Alaska Natives
Immigrants from Barbados
64.7%
IN LABOR FORCE | AGE > 16
9.9/ 100
METRIC RATING
220th/ 347
METRIC RANK
64.4%
IN LABOR FORCE | AGE > 16
2.1/ 100
METRIC RATING
248th/ 347
METRIC RANK
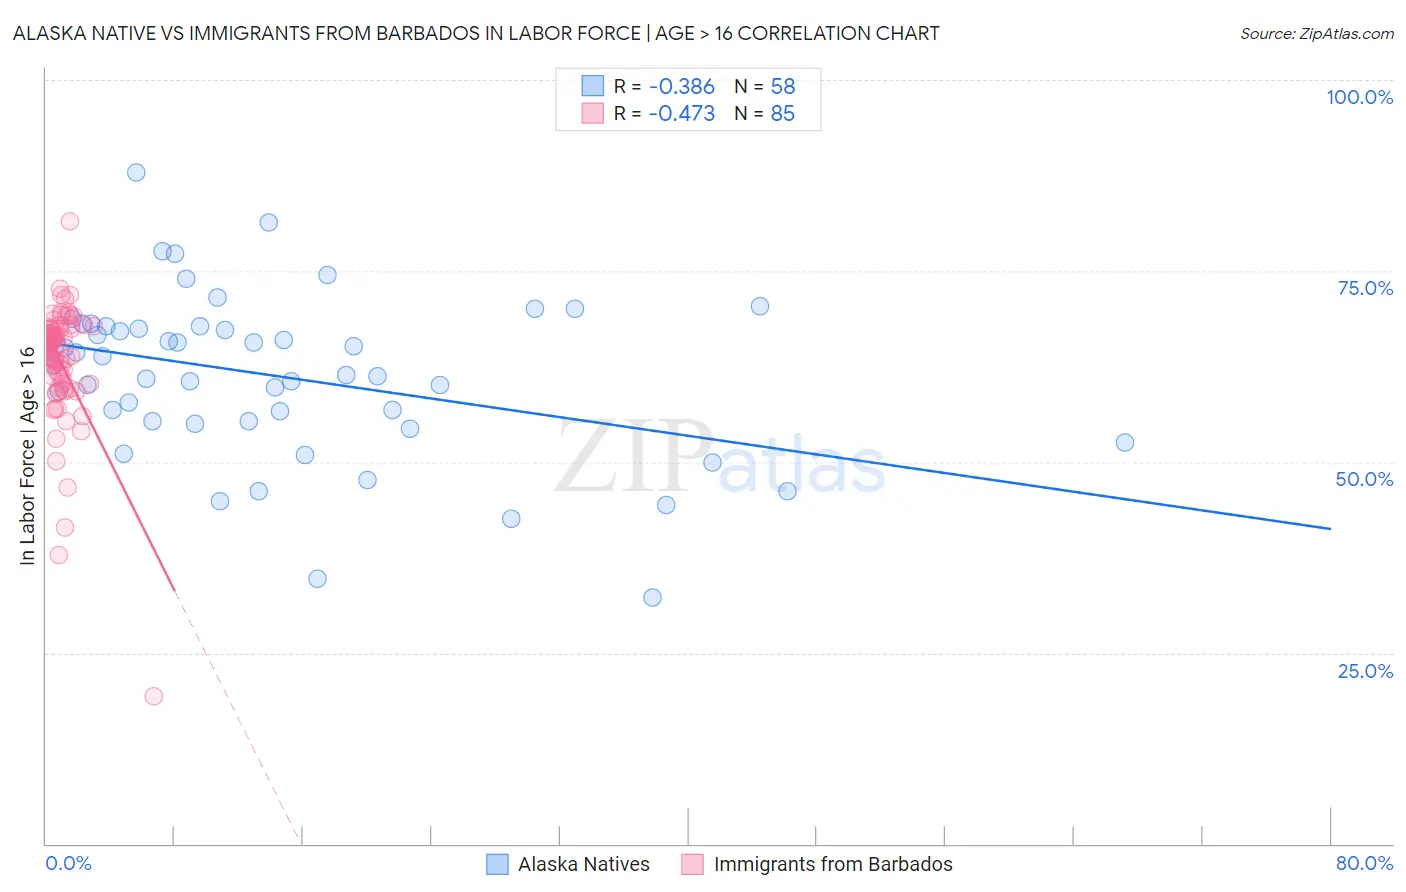
Alaska Native vs Immigrants from Barbados In Labor Force | Age > 16 Correlation Chart
The statistical analysis conducted on geographies consisting of 76,778,571 people shows a mild negative correlation between the proportion of Alaska Natives and labor force participation rate among population ages 16 and over in the United States with a correlation coefficient (R) of -0.386 and weighted average of 64.7%. Similarly, the statistical analysis conducted on geographies consisting of 112,778,506 people shows a moderate negative correlation between the proportion of Immigrants from Barbados and labor force participation rate among population ages 16 and over in the United States with a correlation coefficient (R) of -0.473 and weighted average of 64.4%, a difference of 0.47%.
In Labor Force | Age > 16 Correlation Summary
| Measurement | Alaska Native | Immigrants from Barbados |
| Minimum | 32.2% | 19.3% |
| Maximum | 87.9% | 81.5% |
| Range | 55.7% | 62.2% |
| Mean | 61.2% | 63.2% |
| Median | 62.0% | 65.5% |
| Interquartile 25% (IQ1) | 55.3% | 60.6% |
| Interquartile 75% (IQ3) | 67.7% | 67.3% |
| Interquartile Range (IQR) | 12.4% | 6.7% |
| Standard Deviation (Sample) | 10.7% | 8.0% |
| Standard Deviation (Population) | 10.7% | 7.9% |
Similar Demographics by In Labor Force | Age > 16
Demographics Similar to Alaska Natives by In Labor Force | Age > 16
In terms of in labor force | age > 16, the demographic groups most similar to Alaska Natives are Immigrants from Micronesia (64.7%, a difference of 0.010%), Immigrants from Central America (64.7%, a difference of 0.020%), Hawaiian (64.7%, a difference of 0.020%), Immigrants from Belize (64.7%, a difference of 0.020%), and Alsatian (64.7%, a difference of 0.030%).
| Demographics | Rating | Rank | In Labor Force | Age > 16 |
| Maltese | 13.8 /100 | #213 | Poor 64.8% |
| Estonians | 13.1 /100 | #214 | Poor 64.8% |
| Immigrants | Czechoslovakia | 12.3 /100 | #215 | Poor 64.8% |
| Belgians | 11.4 /100 | #216 | Poor 64.7% |
| U.S. Virgin Islanders | 11.3 /100 | #217 | Poor 64.7% |
| Alsatians | 10.7 /100 | #218 | Poor 64.7% |
| Immigrants | Central America | 10.5 /100 | #219 | Poor 64.7% |
| Alaska Natives | 9.9 /100 | #220 | Tragic 64.7% |
| Immigrants | Micronesia | 9.6 /100 | #221 | Tragic 64.7% |
| Hawaiians | 9.3 /100 | #222 | Tragic 64.7% |
| Immigrants | Belize | 9.2 /100 | #223 | Tragic 64.7% |
| Immigrants | Jamaica | 8.8 /100 | #224 | Tragic 64.7% |
| Croatians | 8.8 /100 | #225 | Tragic 64.7% |
| Europeans | 8.3 /100 | #226 | Tragic 64.7% |
| Poles | 8.3 /100 | #227 | Tragic 64.7% |
Demographics Similar to Immigrants from Barbados by In Labor Force | Age > 16
In terms of in labor force | age > 16, the demographic groups most similar to Immigrants from Barbados are Swiss (64.4%, a difference of 0.010%), Immigrants from Caribbean (64.4%, a difference of 0.030%), German (64.4%, a difference of 0.030%), British West Indian (64.4%, a difference of 0.040%), and Portuguese (64.4%, a difference of 0.060%).
| Demographics | Rating | Rank | In Labor Force | Age > 16 |
| Immigrants | Dominica | 3.5 /100 | #241 | Tragic 64.5% |
| Immigrants | Netherlands | 3.4 /100 | #242 | Tragic 64.5% |
| Immigrants | Lebanon | 3.2 /100 | #243 | Tragic 64.5% |
| Tsimshian | 3.1 /100 | #244 | Tragic 64.5% |
| West Indians | 3.0 /100 | #245 | Tragic 64.5% |
| Immigrants | Caribbean | 2.3 /100 | #246 | Tragic 64.4% |
| Swiss | 2.1 /100 | #247 | Tragic 64.4% |
| Immigrants | Barbados | 2.1 /100 | #248 | Tragic 64.4% |
| Germans | 1.8 /100 | #249 | Tragic 64.4% |
| British West Indians | 1.8 /100 | #250 | Tragic 64.4% |
| Portuguese | 1.6 /100 | #251 | Tragic 64.4% |
| Immigrants | Dominican Republic | 1.5 /100 | #252 | Tragic 64.4% |
| Czechoslovakians | 1.4 /100 | #253 | Tragic 64.3% |
| Immigrants | Uzbekistan | 1.4 /100 | #254 | Tragic 64.3% |
| Hispanics or Latinos | 1.1 /100 | #255 | Tragic 64.3% |