Haitian vs Immigrants from Barbados In Labor Force | Age > 16
COMPARE
Haitian
Immigrants from Barbados
In Labor Force | Age > 16
In Labor Force | Age > 16 Comparison
Haitians
Immigrants from Barbados
65.0%
IN LABOR FORCE | AGE > 16
30.6/ 100
METRIC RATING
196th/ 347
METRIC RANK
64.4%
IN LABOR FORCE | AGE > 16
2.1/ 100
METRIC RATING
248th/ 347
METRIC RANK
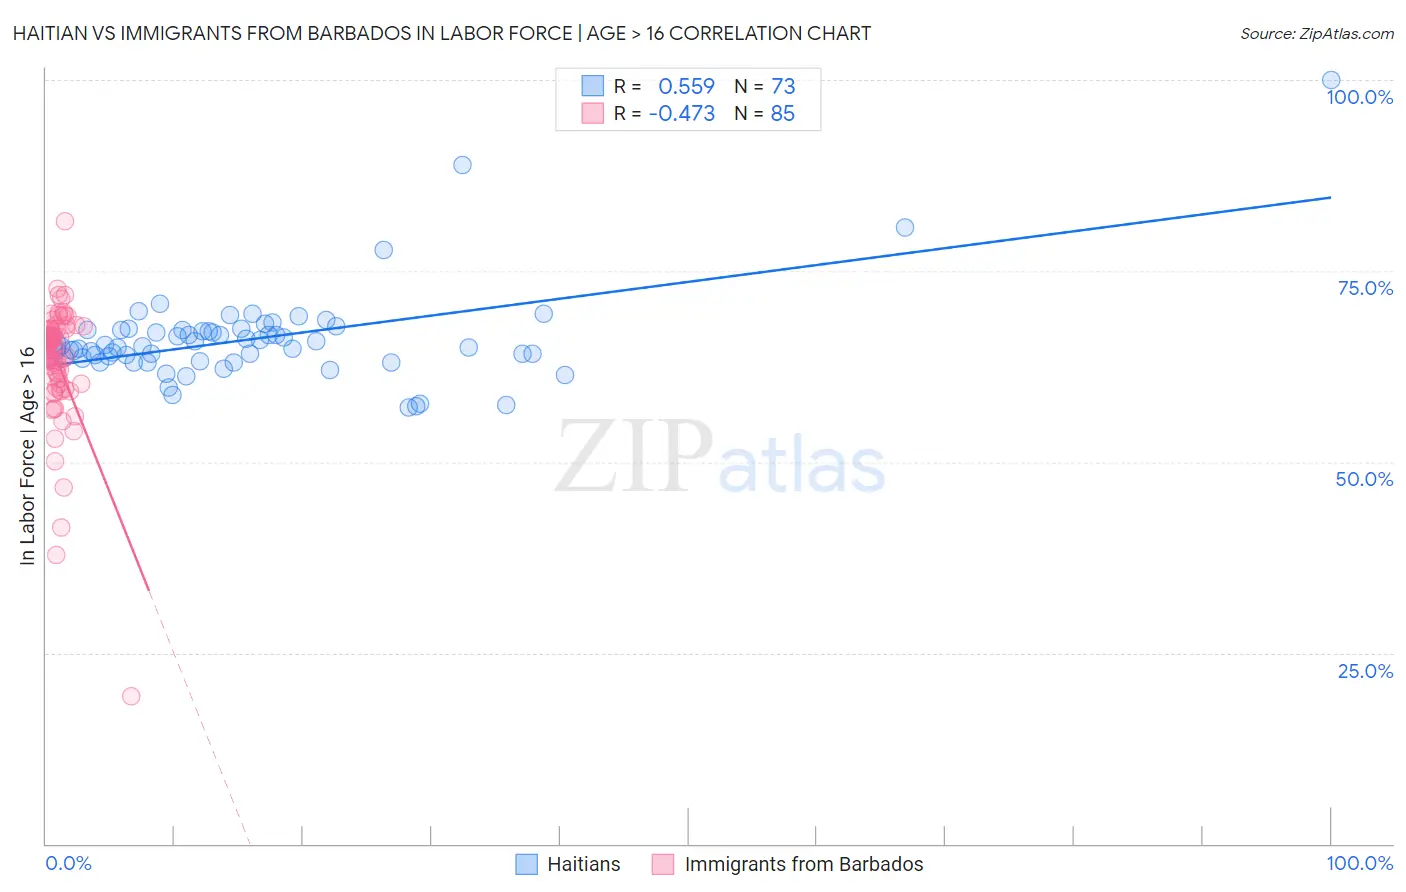
Haitian vs Immigrants from Barbados In Labor Force | Age > 16 Correlation Chart
The statistical analysis conducted on geographies consisting of 288,007,130 people shows a substantial positive correlation between the proportion of Haitians and labor force participation rate among population ages 16 and over in the United States with a correlation coefficient (R) of 0.559 and weighted average of 65.0%. Similarly, the statistical analysis conducted on geographies consisting of 112,778,506 people shows a moderate negative correlation between the proportion of Immigrants from Barbados and labor force participation rate among population ages 16 and over in the United States with a correlation coefficient (R) of -0.473 and weighted average of 64.4%, a difference of 0.86%.
In Labor Force | Age > 16 Correlation Summary
| Measurement | Haitian | Immigrants from Barbados |
| Minimum | 57.2% | 19.3% |
| Maximum | 100.0% | 81.5% |
| Range | 42.8% | 62.2% |
| Mean | 66.1% | 63.2% |
| Median | 65.1% | 65.5% |
| Interquartile 25% (IQ1) | 63.6% | 60.6% |
| Interquartile 75% (IQ3) | 67.3% | 67.3% |
| Interquartile Range (IQR) | 3.6% | 6.7% |
| Standard Deviation (Sample) | 6.2% | 8.0% |
| Standard Deviation (Population) | 6.1% | 7.9% |
Similar Demographics by In Labor Force | Age > 16
Demographics Similar to Haitians by In Labor Force | Age > 16
In terms of in labor force | age > 16, the demographic groups most similar to Haitians are Immigrants from Southern Europe (65.0%, a difference of 0.010%), Romanian (65.0%, a difference of 0.010%), Immigrants from Italy (65.0%, a difference of 0.030%), Barbadian (65.0%, a difference of 0.040%), and Scandinavian (65.0%, a difference of 0.040%).
| Demographics | Rating | Rank | In Labor Force | Age > 16 |
| Immigrants | Greece | 34.3 /100 | #189 | Fair 65.0% |
| Barbadians | 33.9 /100 | #190 | Fair 65.0% |
| Scandinavians | 33.7 /100 | #191 | Fair 65.0% |
| Immigrants | Fiji | 33.7 /100 | #192 | Fair 65.0% |
| Immigrants | Europe | 33.6 /100 | #193 | Fair 65.0% |
| Immigrants | Southern Europe | 31.3 /100 | #194 | Fair 65.0% |
| Romanians | 31.1 /100 | #195 | Fair 65.0% |
| Haitians | 30.6 /100 | #196 | Fair 65.0% |
| Immigrants | Italy | 28.7 /100 | #197 | Fair 65.0% |
| Greeks | 26.1 /100 | #198 | Fair 64.9% |
| Mexican American Indians | 23.1 /100 | #199 | Fair 64.9% |
| Armenians | 20.2 /100 | #200 | Fair 64.9% |
| Ukrainians | 19.6 /100 | #201 | Poor 64.9% |
| Immigrants | Belgium | 19.4 /100 | #202 | Poor 64.9% |
| Russians | 18.8 /100 | #203 | Poor 64.9% |
Demographics Similar to Immigrants from Barbados by In Labor Force | Age > 16
In terms of in labor force | age > 16, the demographic groups most similar to Immigrants from Barbados are Swiss (64.4%, a difference of 0.010%), Immigrants from Caribbean (64.4%, a difference of 0.030%), German (64.4%, a difference of 0.030%), British West Indian (64.4%, a difference of 0.040%), and Portuguese (64.4%, a difference of 0.060%).
| Demographics | Rating | Rank | In Labor Force | Age > 16 |
| Immigrants | Dominica | 3.5 /100 | #241 | Tragic 64.5% |
| Immigrants | Netherlands | 3.4 /100 | #242 | Tragic 64.5% |
| Immigrants | Lebanon | 3.2 /100 | #243 | Tragic 64.5% |
| Tsimshian | 3.1 /100 | #244 | Tragic 64.5% |
| West Indians | 3.0 /100 | #245 | Tragic 64.5% |
| Immigrants | Caribbean | 2.3 /100 | #246 | Tragic 64.4% |
| Swiss | 2.1 /100 | #247 | Tragic 64.4% |
| Immigrants | Barbados | 2.1 /100 | #248 | Tragic 64.4% |
| Germans | 1.8 /100 | #249 | Tragic 64.4% |
| British West Indians | 1.8 /100 | #250 | Tragic 64.4% |
| Portuguese | 1.6 /100 | #251 | Tragic 64.4% |
| Immigrants | Dominican Republic | 1.5 /100 | #252 | Tragic 64.4% |
| Czechoslovakians | 1.4 /100 | #253 | Tragic 64.3% |
| Immigrants | Uzbekistan | 1.4 /100 | #254 | Tragic 64.3% |
| Hispanics or Latinos | 1.1 /100 | #255 | Tragic 64.3% |