Immigrants from Senegal vs Immigrants from Barbados In Labor Force | Age > 16
COMPARE
Immigrants from Senegal
Immigrants from Barbados
In Labor Force | Age > 16
In Labor Force | Age > 16 Comparison
Immigrants from Senegal
Immigrants from Barbados
66.4%
IN LABOR FORCE | AGE > 16
99.9/ 100
METRIC RATING
56th/ 347
METRIC RANK
64.4%
IN LABOR FORCE | AGE > 16
2.1/ 100
METRIC RATING
248th/ 347
METRIC RANK
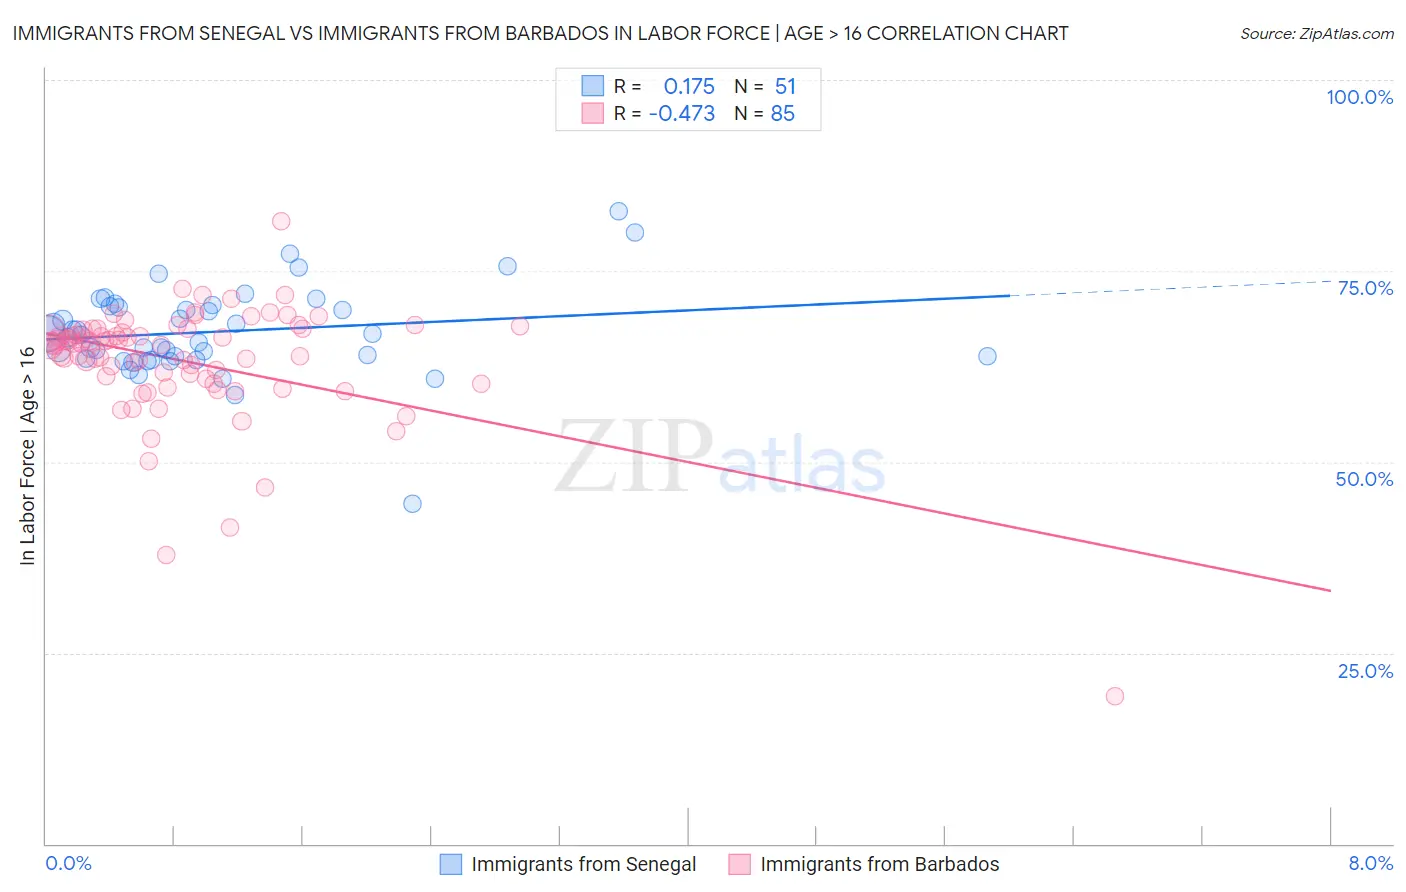
Immigrants from Senegal vs Immigrants from Barbados In Labor Force | Age > 16 Correlation Chart
The statistical analysis conducted on geographies consisting of 90,129,295 people shows a poor positive correlation between the proportion of Immigrants from Senegal and labor force participation rate among population ages 16 and over in the United States with a correlation coefficient (R) of 0.175 and weighted average of 66.4%. Similarly, the statistical analysis conducted on geographies consisting of 112,778,506 people shows a moderate negative correlation between the proportion of Immigrants from Barbados and labor force participation rate among population ages 16 and over in the United States with a correlation coefficient (R) of -0.473 and weighted average of 64.4%, a difference of 3.1%.
In Labor Force | Age > 16 Correlation Summary
| Measurement | Immigrants from Senegal | Immigrants from Barbados |
| Minimum | 44.5% | 19.3% |
| Maximum | 82.8% | 81.5% |
| Range | 38.3% | 62.2% |
| Mean | 67.1% | 63.2% |
| Median | 66.7% | 65.5% |
| Interquartile 25% (IQ1) | 63.6% | 60.6% |
| Interquartile 75% (IQ3) | 70.4% | 67.3% |
| Interquartile Range (IQR) | 6.9% | 6.7% |
| Standard Deviation (Sample) | 5.9% | 8.0% |
| Standard Deviation (Population) | 5.9% | 7.9% |
Similar Demographics by In Labor Force | Age > 16
Demographics Similar to Immigrants from Senegal by In Labor Force | Age > 16
In terms of in labor force | age > 16, the demographic groups most similar to Immigrants from Senegal are Bulgarian (66.4%, a difference of 0.010%), Immigrants from Venezuela (66.4%, a difference of 0.030%), Immigrants from Bosnia and Herzegovina (66.5%, a difference of 0.080%), Immigrants from Sri Lanka (66.5%, a difference of 0.11%), and Immigrants from Saudi Arabia (66.3%, a difference of 0.11%).
| Demographics | Rating | Rank | In Labor Force | Age > 16 |
| Immigrants | Northern Africa | 100.0 /100 | #49 | Exceptional 66.6% |
| Cape Verdeans | 100.0 /100 | #50 | Exceptional 66.6% |
| Immigrants | Kuwait | 100.0 /100 | #51 | Exceptional 66.5% |
| Paraguayans | 99.9 /100 | #52 | Exceptional 66.5% |
| Immigrants | Sri Lanka | 99.9 /100 | #53 | Exceptional 66.5% |
| Immigrants | Bosnia and Herzegovina | 99.9 /100 | #54 | Exceptional 66.5% |
| Immigrants | Venezuela | 99.9 /100 | #55 | Exceptional 66.4% |
| Immigrants | Senegal | 99.9 /100 | #56 | Exceptional 66.4% |
| Bulgarians | 99.9 /100 | #57 | Exceptional 66.4% |
| Immigrants | Saudi Arabia | 99.9 /100 | #58 | Exceptional 66.3% |
| Immigrants | Turkey | 99.9 /100 | #59 | Exceptional 66.3% |
| Immigrants | Peru | 99.8 /100 | #60 | Exceptional 66.3% |
| Immigrants | Burma/Myanmar | 99.8 /100 | #61 | Exceptional 66.3% |
| Indonesians | 99.8 /100 | #62 | Exceptional 66.3% |
| Venezuelans | 99.8 /100 | #63 | Exceptional 66.3% |
Demographics Similar to Immigrants from Barbados by In Labor Force | Age > 16
In terms of in labor force | age > 16, the demographic groups most similar to Immigrants from Barbados are Swiss (64.4%, a difference of 0.010%), Immigrants from Caribbean (64.4%, a difference of 0.030%), German (64.4%, a difference of 0.030%), British West Indian (64.4%, a difference of 0.040%), and Portuguese (64.4%, a difference of 0.060%).
| Demographics | Rating | Rank | In Labor Force | Age > 16 |
| Immigrants | Dominica | 3.5 /100 | #241 | Tragic 64.5% |
| Immigrants | Netherlands | 3.4 /100 | #242 | Tragic 64.5% |
| Immigrants | Lebanon | 3.2 /100 | #243 | Tragic 64.5% |
| Tsimshian | 3.1 /100 | #244 | Tragic 64.5% |
| West Indians | 3.0 /100 | #245 | Tragic 64.5% |
| Immigrants | Caribbean | 2.3 /100 | #246 | Tragic 64.4% |
| Swiss | 2.1 /100 | #247 | Tragic 64.4% |
| Immigrants | Barbados | 2.1 /100 | #248 | Tragic 64.4% |
| Germans | 1.8 /100 | #249 | Tragic 64.4% |
| British West Indians | 1.8 /100 | #250 | Tragic 64.4% |
| Portuguese | 1.6 /100 | #251 | Tragic 64.4% |
| Immigrants | Dominican Republic | 1.5 /100 | #252 | Tragic 64.4% |
| Czechoslovakians | 1.4 /100 | #253 | Tragic 64.3% |
| Immigrants | Uzbekistan | 1.4 /100 | #254 | Tragic 64.3% |
| Hispanics or Latinos | 1.1 /100 | #255 | Tragic 64.3% |